Figures & data
Table 1. Number of participants, stakeholder representatives, and drop-out in each interview.
Table 2. Number of participants from each stakeholder.
Figure 1. Extract from the analysis process. Examples related to the category “Improving continuity and coordination”, from first codes to final categories and subcategories.
A set of 26 boxes. Codes, subcategories, categories, and condensation of categories are exemplified with text in the boxes. The different steps in the analysis are visualized with arrows showing the connection between the boxes.
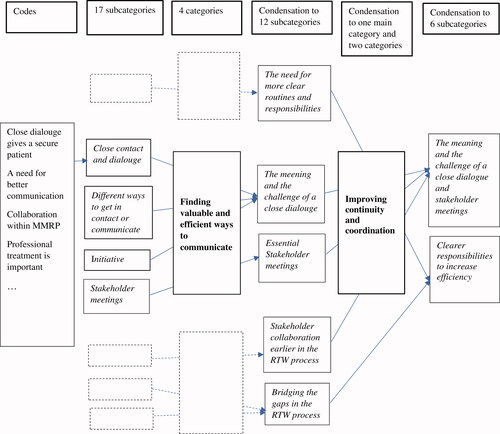
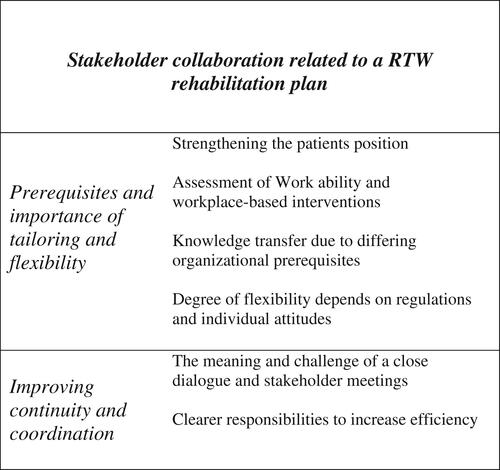
Figure 2. Overview of categories and subcategories.
At the top of the figure, the main category “Stakeholder collaboration related to an RTW rehabilitation plan” is presented. Down below to the left, the two categories “Prerequisites and importance of tailoring and flexibility” and “Improving continuity and coordination” are presented. To the right, the six subcategories are presented.