
Figures & data
Table 1. Demographics, subjective symptomatology, and neuropsychological functioning in traumatic brain injury and healthy control groups.
Figure 1. Relationship between effort and fatigue following the task for TBI participants (black circles) and controls (white triangles), including the 95% confidence intervals. VASpost: Visual Analog Scale fatigue immediately after the task; RSME: Rating Scale Mental Effort.
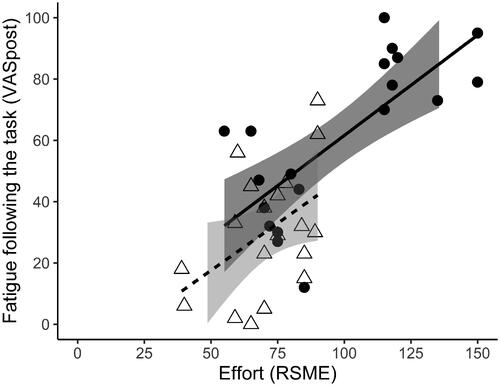
Table 2. Effort score and fatigue scores at the different time points for the traumatic brain injury and healthy control groups.
Table 3. Correlations between effort and fatigue scores for the traumatic brain injury and healthy control group.
Table 4. Results of hierarchical multiple linear regression analysis of the relationship between effort and fatigue, including the effect of group (traumatic brain injury and healthy controls) and the interaction between effort and group.
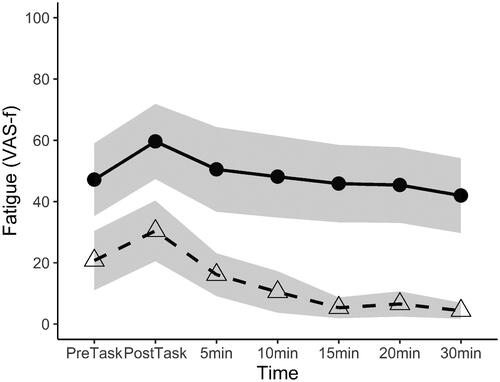
Figure 2. Levels of fatigue before and following the task, showing the task-induced increase and decline in fatigue during the 30-min rest-period for participants with TBI (circles, solid line) and controls (triangles, dashed line) with 95% confidence intervals (grey area). VAS-f: Visual Analog Scale fatigue; PreTask: before the task; PostTask: immediately after the task.
SupplementaryTable_EffortFatigueTBI.pdf
Download PDF (379 KB)Data availability statement
Data can be obtained via the Dutch Dataverse Network upon request: https://doi.org/10.34894/FA2XYR.