Figures & data
Figure 1. Flow diagram of patient progress through the pilot study.
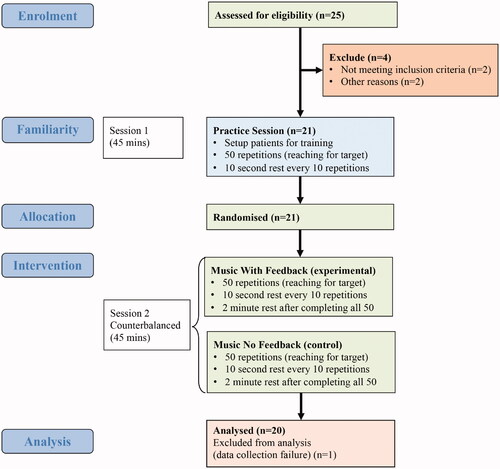
Table 1. Demographic and clinical characteristics of patients.
Figure 2. The patient seated upright with their wrist on the edge of a height adjusted table. They move their hand forward to reach a target button (marked with X) before returning to the original start position. A 2D webcam positioned at 2 o’clock/60 degrees relative to the patient collects video footage of their movement and sends kinematic data into a machine learning system.
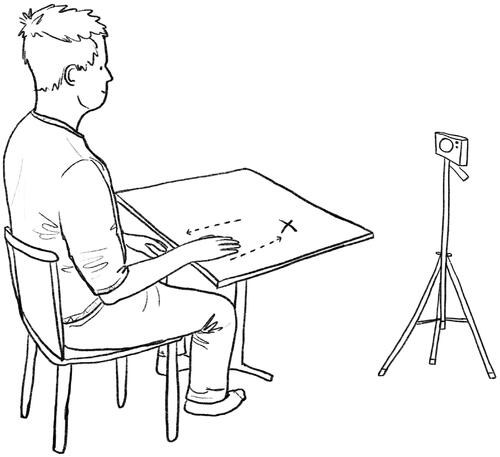
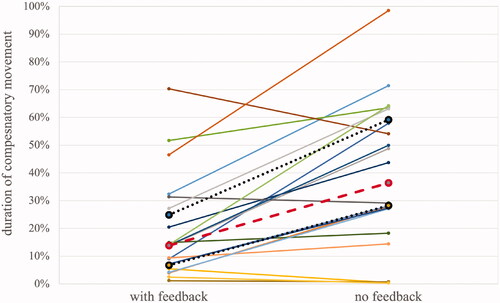
Figure 3. The duration of abnormal movement for 20 patients undertaking 50 repetitions with auditory feedback compared to 50 repetitions with no feedback. Error bars are adjusted 95% CI removing between-subject variability.
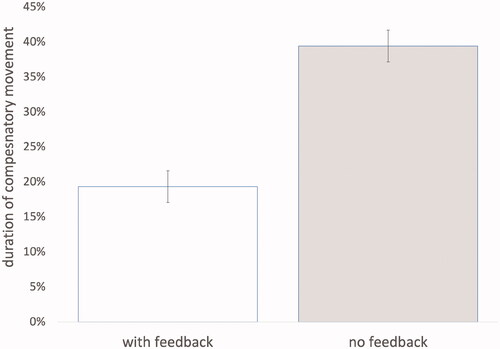
Figure 4. The duration of abnormal movement for 20 patients who provided full datasets (with and without auditory feedback). Median (dashed line), upper and lower quartiles (dotted lines) are shown.