
Figures & data
Figure 1. Flowchart of measurement time points (diamonds) of trained and untrained patients opting for 1–3 level lumbar spinal fusion surgery. SRT: Steep Ramp Test; T: time point.
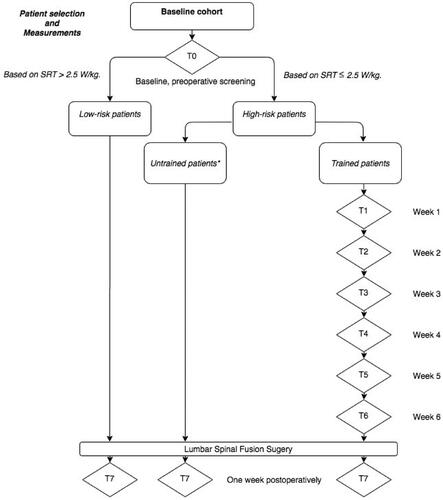
Figure 2. Flowchart of the in- and exclusion of patients. LSF: lumbar spinal fusion. *Outliers were defined as any value that is more than 1.5 IQR below the first quartile or above the third quartile.
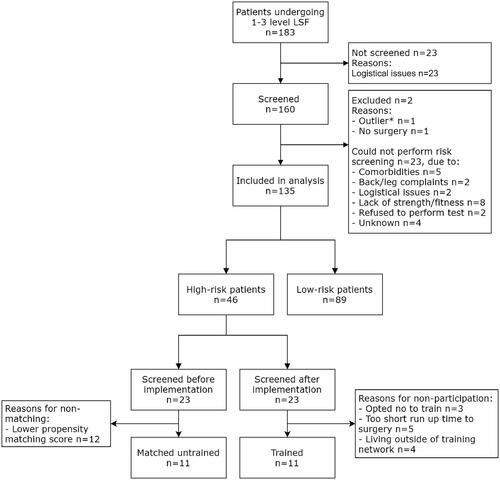
Table 1. Baseline characteristics for high-risk and low-risk patients undergoing elective level one to three LSF.
Figure 3. (a–d) Per patient progression on: a) the 30 s Chair Stand Test, b) the 2 min Walk Test and c) the Timed Up and Go test between week 0 and 4 of training, and d) per patient progression on the Steep Ramp Test between week 0 of training and directly preoperatively.
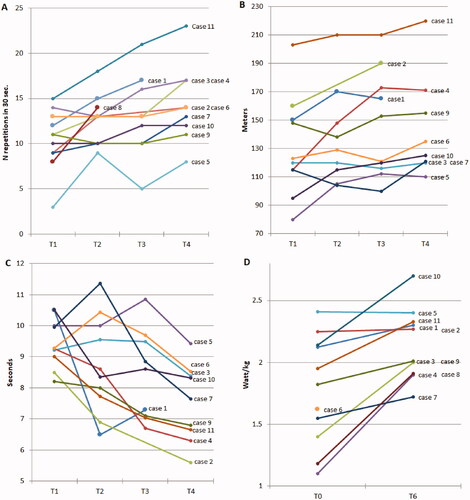
Figure 4. (a and b) A boxplot comparing the trained and untrained high-risk patients on postoperative: a) time to functional recovery and b) length of hospital stay.
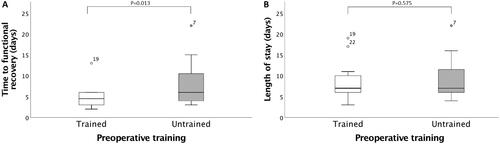
Table 2. Baseline characteristics for high-risk patients undergoing elective level one to three LSF.
Figure 5. Effect of implementation of preoperative f-HIIT program on time to functional recovery (in days) in the matched high-risk population (n = 22).
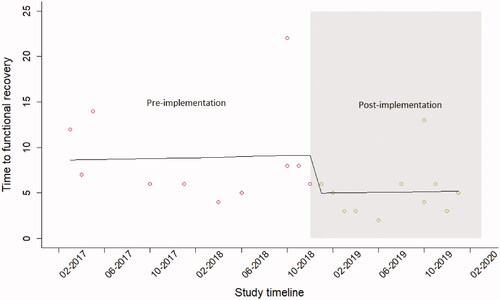
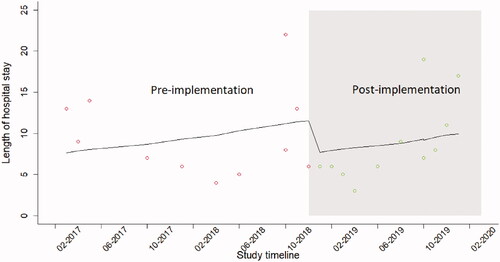
Figure 6. Effect of implementation of preoperative f-HIIT program on length of hospital stay in the matched high-risk population (n = 22).
Data availability statement
The data that support the findings of this study are available on request from the corresponding author, EJ. The data are not publicly available due to restrictions e.g., their containing information that could compromise the privacy of research participants.