
Figures & data
Figure 1. CONSORT 2010 flow diagram. Flow chart showing initially contacted patients, excluded before randomisations, enrolled participants, number of participants in each intervention group, and number of evaluated participants after treatment.
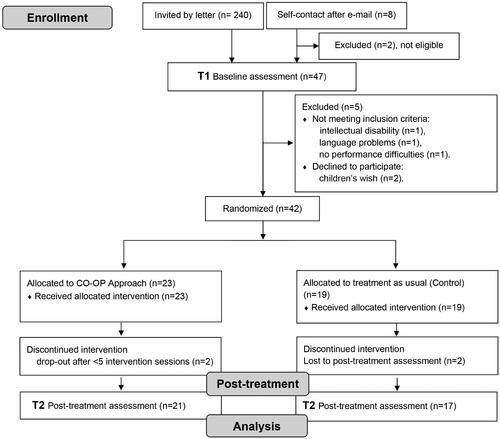
Table 1. Participants’ demographics.
Table 2. BRIEF scores: children’s self-reports and parent’s report at baseline (T1), CO-OP group and control group.
Table 3. Proportion of goals with an increase of ≥2 points between T1 and T2.
Figure 2. Boxplots showing differences between T1 and T2 in children’s rating of COPM performance and satisfaction for trained and untrained goals. Boxplot diagram showing median and interval differences in self-rated performance and satisfaction with COPM between baseline and post-treatment assessment. The picture shows ratings from both the children in the group who received CO-OP training and from those in the control group, for both trained and untrained goals.
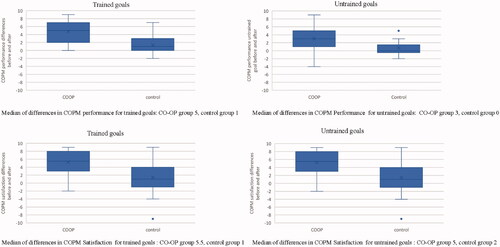
Figure 3. Boxplots showing differences between T1 and T2 in blinded rating of PQRS for trained and untrained goals. Boxplot diagram showing the median and interval for differences between baseline and post-treatment assessment in objective, blinded assessment of goal attainment with PQRS, for both the group that received CO-OP training and for the control group, in both trained and untrained goals.
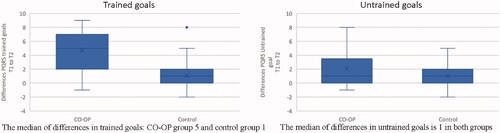
Table 4. Results for executive function, D-KEFS sub-tests in CO-OP group and control group, within-group analysis.