Figures & data
Figure 1. Visual display of different forms of extrinsic feedback.
Tree figure depicting varying forms of extrinsic feedback, divided into the following categories: modality, focus, specificity, timing, frequency, and level of guidance.
Tree figure depicting varying forms of extrinsic feedback, divided into five categories, shown in squares. It starts with modality of the feedback: auditory, visual, sensory or verbal. From verbal feedback, an arrow leads to the next square holding further specifications of verbal feedback. These are: the focus of the feedback (that is, knowledge of performance versus knowledge of results feedback), and the level of specificity of the feedback (that is, quantitative versus qualitative feedback). From this square, three arrows lead to the last three squares aligned vertically underneath each other, each holding one category. The upper square holds “Timing”, that is, concurrent versus terminal feedback. The middle square holds Frequency, that is, 100% versus less than 100% feedback. Under the latter, four bullet points show four manners of reducing the feedback frequency, namely: faded, summative slash averaged, performance based-bandwidth, and self-controlled feedback. The lower and final square holds the level of guidance, that is, prescriptive versus descriptive feedback. Underneath the latter are two bullet points, showing two options with regard to the informational content of the descriptive feedback, that is, correct aspects information versus error information.
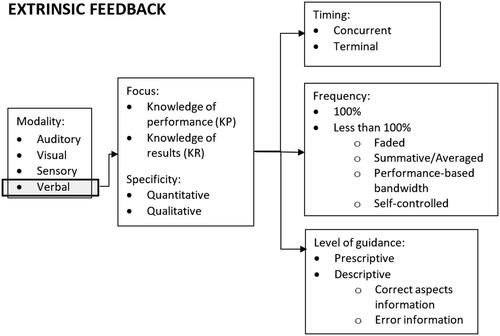
Figure 2. Flow chart depicting the process of inclusion of studies.
PRISMA flow chart displaying the process of search and selection of included studies. From 404 records coming out of the initial search, 12 studies were ultimately included in this review.
This flow chart shows the process of search and selection of included studies, following the PRISMA guidelines. Firstly, 401 records were identified through database searching, and three additional records were identified through other sources. After duplicates were removed, 358 records remained, which were all screened. Two hundred eighty-nine records were excluded, based on title and abstract. The remaining 69 articles were assessed for eligibility based on full-text versions. In this process, 57 articles were excluded for several reasons. Of these excluded articles, 30 concerned biofeedback; 6 articles concerned mirror therapy; 7 articles made no comparison between modalities or frequencies, or between samples of typically developing children and children with cerebral palsy; 9 articles only examined motor performance, and not motor learning; 5 articles examined adults, and not children with cerebral palsy. Ultimately, 12 studies were included in our qualitative synthesis.
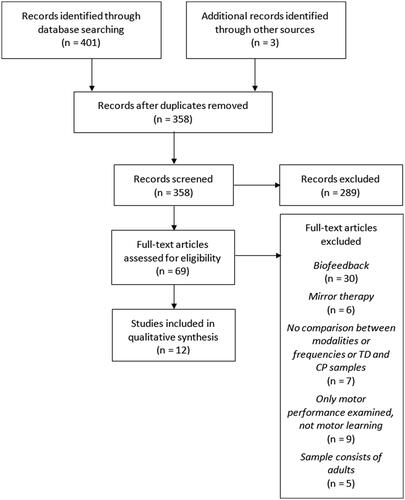
Table 1. Extracted details of the included studies applying knowledge of results feedback.
Table 2. Extracted details of the included studies applying knowledge of performance feedback.
Figure 3. Results of risk-of-bias assessment for each study. Green = low risk of bias; red = high risk of bias; yellow = some concerns.
Results of the risk of bias assessment per study for each of the five domains, and the overall risk of bias. One study, from Hamed and Abd-elwahab, has a low overall risk of bias; six studies have a high overall risk of bias; and five studies have some concerns.
These are the results of the Risk of Bias assessment per study for each of the five domains, and the overall risk of bias. Baram and Lenger, 2011. Randomization process: some concerns. Deviations from the intended interventions: low risk. Missing outcome data: low risk. Measurement of the outcome: some concerns. Selection of the reported result: some concerns. Overall: some concerns. Burtner and alia, 2014. Randomization process: some concerns. Deviations from the intended interventions: low risk. Missing outcome data: low risk. Measurement of the outcome: low risk. Selection of the reported result: low risk. Overall: some concerns. Hamed and Abd-elwahab, 2011. Randomization process: low risk. Deviations from the intended interventions: low risk. Missing outcome data: low risk. Measurement of the outcome: low risk. Selection of the reported result: low risk. Overall: low risk. Harbourne, 2001. Randomization process: some concerns. Deviations from the intended interventions: some concerns. Missing outcome data: low risk. Measurement of the outcome: low risk. Selection of the reported result: high risk. Overall: high risk. Hemayattalab and Rostami, 2010. Randomization process: some concerns. Deviations from the intended interventions: some concerns. Missing outcome data: some concerns. Measurement of the outcome: some concerns. Selection of the reported result: high risk. Overall: high risk. Hemayattalab and alia, 2013. Randomization process: some concerns. Deviations from the intended interventions: low risk. Missing outcome data: low risk. Measurement of the outcome: low risk. Selection of the reported result: some concerns. Overall: some concerns. Hemayattalab, two thousand fourteen. Randomization process: some concerns. Deviations from the intended interventions: low risk. Missing outcome data: low risk. Measurement of the outcome: low risk. Selection of the reported result: low risk. Overall: some concerns. Hussein and alia, 2019. Randomization process: low risk. Deviations from the intended interventions: some concerns. Missing outcome data: some concerns. Measurement of the outcome: some concerns. Selection of the reported result: high risk. Overall: high risk. Kara and alia, 2020. Randomization process: some concerns. Deviations from the intended interventions: some concerns. Missing outcome data: some concerns. Measurement of the outcome: some concerns. Selection of the reported result: some concerns. Overall: some concerns. Talbot and Junkala, 1981 Randomization process: some concerns. Deviations from the intended interventions: low risk. Missing outcome data: low risk. Measurement of the outcome: some concerns. Selection of the reported result: high risk. Overall: high risk. Thorpe and Valvano, 2002. Randomization process: some concerns. Deviations from the intended interventions: some concerns. Missing outcome data: some concerns. Measurement of the outcome: some concerns. Selection of the reported result: high risk. Overall: high risk. Valvano and Newell, 1995. Randomization process: some concerns. Deviations from the intended interventions: low risk. Missing outcome data: low risk. Measurement of the outcome: high risk. Selection of the reported result: some concerns. Overall: high risk.
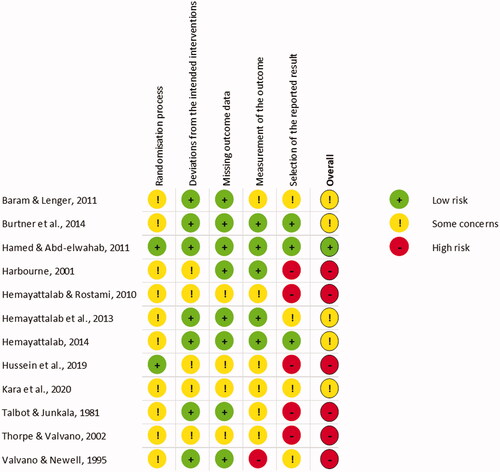
Figure 4. Results of risk-of-bias assessment per domain. Green = low risk of bias; red = high risk of bias; yellow = some concerns.
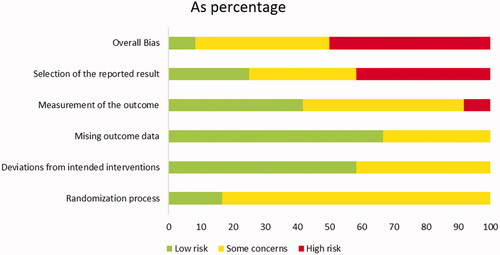
Figure showing the percentages of the three verdicts given in each domain, as well as the overall risk of bias. Overall, 8.3% of the studies shows low risk of bias; 41.7% shows some concerns. Fifty percent shows high risk of bias. The domain where relatively many studies, namely 41.7%, showed a high risk of bias, was the domain “selection of the reported result”.
These are the risk of bias results in percentage for each of the five domains, as well as the overall risk of bias. Randomization process: 16.7% of the studies shows low risk of bias; 83.3% shows some concerns; 0% shows high risk of bias. Deviations from intended interventions: 58.3% of the studies shows low risk of bias; 41.7% shows some concerns; 0% shows high risk of bias. Missing outcome data: 66.7% of the studies shows low risk of bias; 33.3% shows some concerns; 0% shows high risk of bias. Measurement of the outcome: 41.7% of the studies shows low risk of bias; 50% shows some concerns; 80.3% shows high risk of bias. Selection of the reported result: 25% of the studies shows low risk of bias; 33.3% shows some concerns; 41.7% shows high risk of bias. Overall: 8.3% of the studies shows low risk of bias;41.7% shows some concerns; 50% shows high risk of bias.