
Figures & data
Table 1. Participant characteristics (n = 15).
Figure 1. Mean health, wellbeing, and community integration scores (panels A–C, respectively) at pre- and post-move (bars represent standard deviation). Higher scores indicate more positive outcomes.
Panel A. Bar graph demonstrating pre-move and post-move mean health scores. Health scores are higher at post-move. Panel B. Bar graph demonstrating pre-move and post-move mean wellbeing scores. Wellbeing scores are higher at post-move. Panel C. Bar graph demonstrating pre-move and post-move mean community integration scores. Community integration scores are higher at post-move.
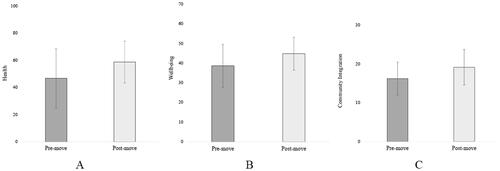
Table 2. Pre vs. post move comparisons: health, wellbeing, and community integration (paired sample t-tests; n = 15).
Table 3. Reliable change analysis for EQ-VAS, WEMWBS, and CIQ-R (n = 15).
Table 4. Correlation of post-move outcome scores with time post-move (weeks) (n = 15).