
Figures & data
Figure 1. Flowchart of participant recruitment, allocation and outcome assessment.
Flowchart of the two arm pre-stratified randomized control trial. Starting with the recruitment of the labour experts, stratified to urban and rural, then randomized to the intervention (CARm method) and care as usual groups followed by the inclusion of the number of clients by the labour experts in both groups, including the number of clients lost to follow up after 3 and 12 months.
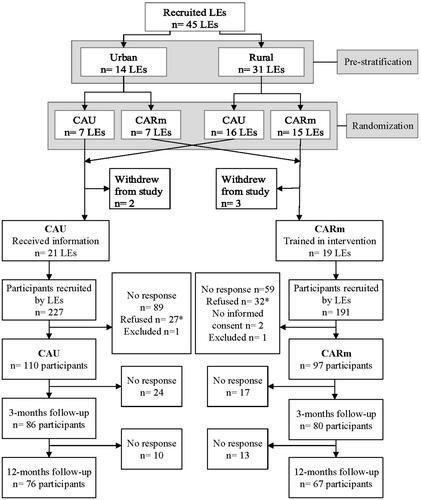
Table 1. Characteristics of labour experts per study group.
Table 2. Baseline characteristics of clients per study group.
Figure 2. Unadjusted paid employment rates per month of clients in CARm intervention and CAU groups.
Line graph with monthly paid employment rates of clients in the intervention (CARm method) and control groups, from the inclusion in the study until one year follow-up, with 95% confidence intervals.
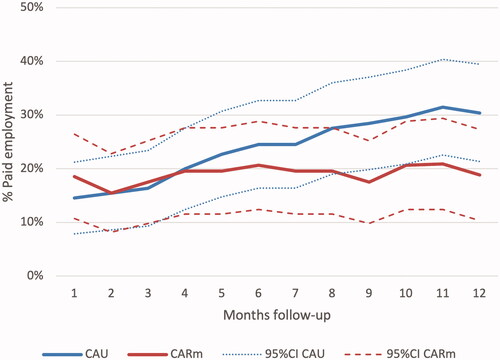
Table 3. Logistic multilevel analyses of paid employment of clients in CARm intervention and CAU groups during 12 months follow-up.
Table 4. Linear multilevel regression analyses of questionnaire data of CARm intervention and CAU group clients using baseline to 12 months follow-up data.
Data availability statement
The data that support the findings of this study are available from the authors on reasonable request.