
Figures & data
Table 1. Results of Rasch analyses.
Table 2. Final Rasch-built “Facial Function Scale”.
Figure 1. Distribution of facial function evaluation (ability location) as assessed with the Facial Function Scale and threshold map of the final 25-item scale.
Upper section contains a bar chart that shows that the distribution of facial function evaluation of the 119 FSHD patients as assessed with the Facial Function Scale. There is a small floor and ceiling effect, and minor gaps of less than 1 logit between person abilities at both ends of the scale. Lower section shows a threshold map ordering the final 25 items of the Facial Function Scale from the most challenging item (blowing up a balloon) to the least challenging item (fatiguing of the face during eating).
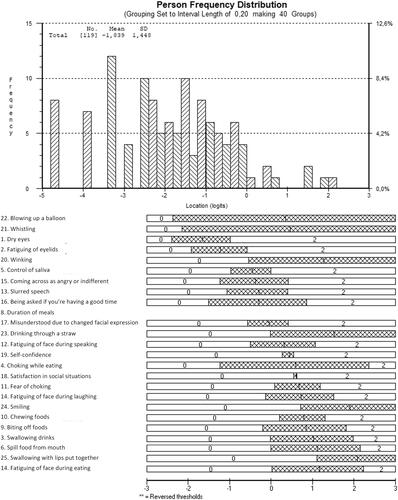
Table 3. Nomogram.
Supplemental material
Supplemental Material
Download Zip (200.5 KB)Data availability statement
The data that support the findings of this study are available from the corresponding author upon reasonable request.