
Figures & data
Table 1. Potential determinants of spoken language comprehension included in the study, ordered by level of the International Classification of Functioning, Disability, and Health for Children and Youth.
Table 2. Demographic and cerebral palsy-related characteristics of the participants.
Figure 1. C-BiLLT raw score by age in months, filtered by GMFCS level.
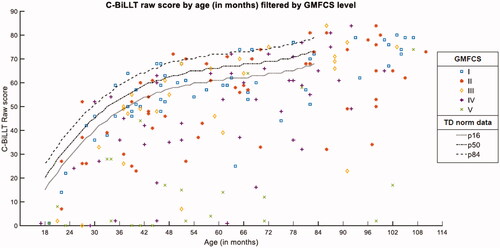
Table 3. C-BiLLT performances per developmental stage and potential determinants.
Table 4. Univariate analysis of determinants per developmental stage of spoken language comprehension (C-BiLLT raw scores).
Table 5. Multivariable analysis of determinants per developmental stage of spoken language comprehension (C-BiLLT raw scores).
2022-03-16_T0_article_disreh_supplementalfile_figure3s_color.pdf
Download PDF (237.5 KB)2022-03-16_T0_article_disreh_supplementalfile_figure2s_color.pdf
Download PDF (65.6 KB)2022-03-16_T0_article_disreh_supplementalfile_figure1s_color.pdf
Download PDF (37.9 KB)Data availability statement
The data that support the findings of this study are available from the corresponding author (EV), upon reasonable request.