
Figures & data
Table 1. Demographic, education, and employment profile of persons with hearing disability in Canada, 2017 (N = 1 334 520).
Table 2. Employment profile of persons with hearing disability in Canada, 2017 (N = 1 334 520).
Table 3. Logistic regression model for predictors of employment for adults with hearing disability in Canada, 2017 (N = 631 040).
Table 4. Needed and available workplace accommodations for individuals with hearing disability (N = 434 770).
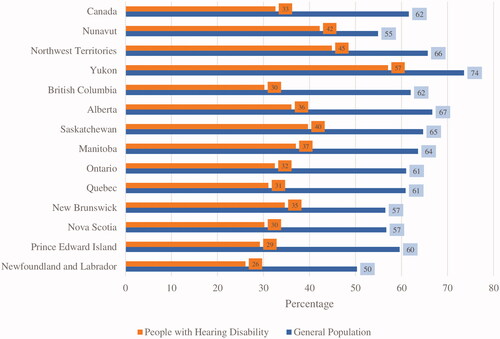
Figure 1. Employment rates of general population and people with hearing disability in 2017. Notes: The employment rate is the number of persons employed expressed as a percentage of the population 15 years of age and over. The employment rate for a particular group (individuals with hearing disability) is the number employed in that group expressed as a percentage of the population for that group. Estimates are percentages, rounded to the nearest tenth. All rates in the charts/tables are calculated excluding non-response categories ("refusal," "don't know," and "not stated") in the denominator.
Data availability statement
Data used in this study contain potentially sensitive information, and therefore, are restricted to be released by Statistics Canada. Data access request can be made at the Research Data Centres of Statistics Canada (Queen's University Research Data Centre in this case – [email protected]) via research analysts at the designated institutions. Please note that data will be only available to researchers who meet the criteria for access to confidential data.