Figures & data
Figure 1. Inclusion of participants (psychologists and managers) from Swedish and Norwegian habilitation centers.
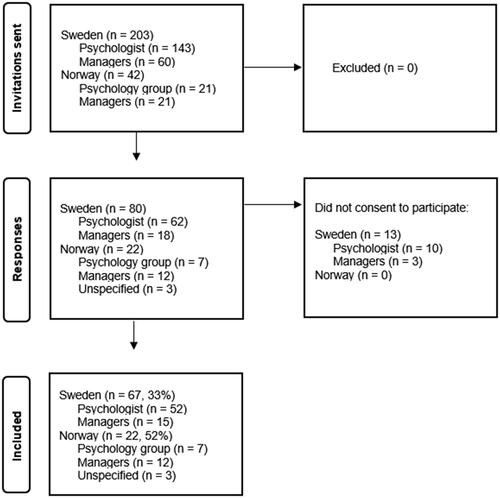
Table 1. Prerequisites for implementing a project according to the Breakthrough model of cooperation for improvement of health services and status in Norwegian national quality improvement project prior to launch of project.
Figure 2. Reasons listed by Swedish psychologists as why the CPCog was not followed (N = 24).
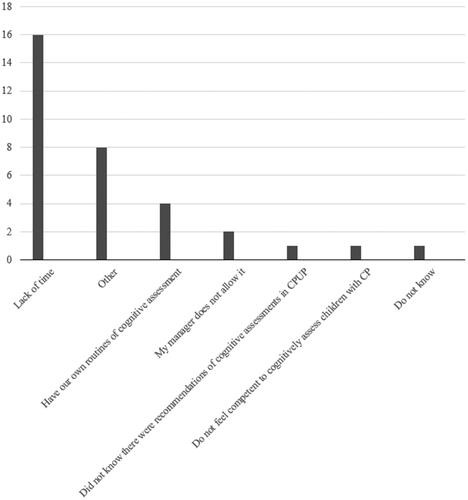
Table 2. Reported assessment practices and adherence to the CPCog protocol in pediatric habilitation centers in Sweden (N = 203 respondents; psychologists and managers) and Norway (N = 22 respondents; centers), number and percentage reported for each question.a
Table 3. Number of children assessed annually with a cognitive test at a Swedish pediatric habilitation center, presented in relation to groups reported assessed (age and Gross Motor Function Classification System level), and the center’s knowledge of and adherence to the CPCog protocol, as reported by psychologist and managers.
Table 4. Number of children assessed annually with a cognitive test at a Norwegian pediatric habilitation centers (N = 20 centers), presented in relation to groups reported assessed (age and Gross Motor Function Classification System levels), and the centers’ knowledge about and adherence to the CPCog protocol.
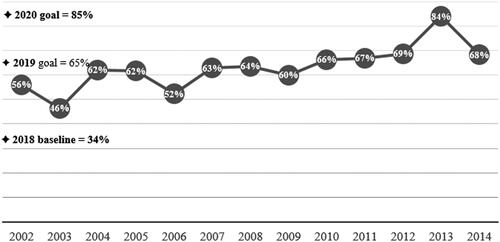
Figure 3. Percentage of children with cerebral palsy in the Norwegian Quality and Surveillance Registry for Cerebral Palsy recorded as having been cognitively assessed, as registered from 2013 to 2020.
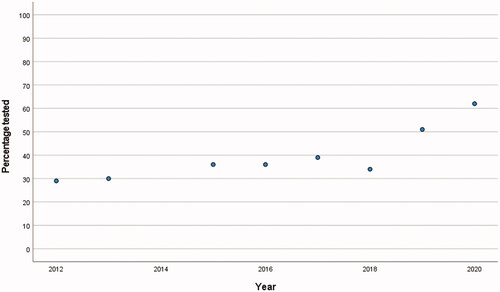
Figure 4. Percentage of children with cerebral palsy in the Norwegian Quality and Surveillance Registry for Cerebral Palsy recorded with at least one cognitive assessment with a standardized measure per birth year as of December 31, 2020.