Figures & data
Table 1. Stroke participant characteristics (n = 30).
Table 2. Footwear characteristics.
Table 3. Foot problems identified by the podiatrist using the IMFAA (n = 30).
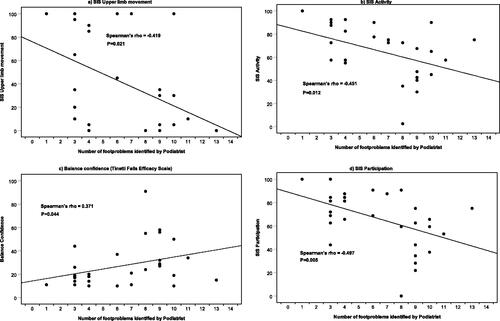
Figure 1. Four scatter plots showing the correlation between number of foot problems identified by the podiatrist during the assessment and three different Stroke Impact Scale sections and balance confidence as measured using the Tinetti Falls Efficacy Scale.
Plots a, b, and d show a negative correlation between foot problems and upper limb movement, physical activity and community participation as measured using the Stroke Impact Scale and plot c shows a positive correlation for balance confidence. The correlations shown suggest that people who presented with a greater number of foot problems were also observed to present with reduced upper limb function, were less physically active and had reduced balance confidence and reduced community participation.