
Figures & data
Figure 1. Flow of studies through the review.
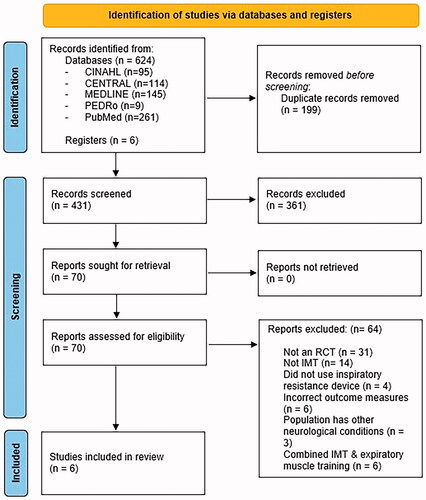
Table 1. Summary of included studies (n = 6).
Figure 2. Risk of bias of included studies assessed using the Cochrane Risk of Bias Tool.
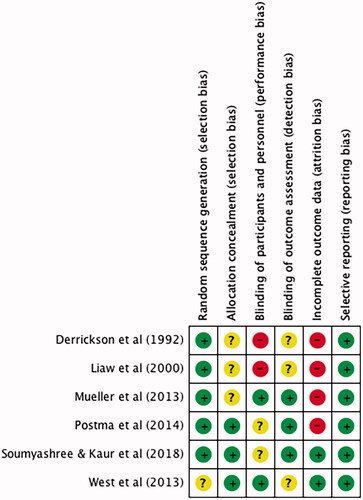
Figure 3. Mean difference (95% CI) in maximal inspiratory pressure (cmH2O) due to inspiratory muscle training, estimated by pooling data from six studies (n = 124).
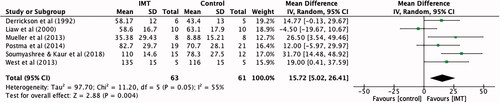
Figure 4. Mean difference (95% CI) in maximal expiratory pressure (cmH2O) due to inspiratory muscle training, estimated by pooling data from five studies (n = 113).
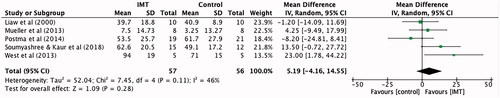
Figure 5. Standardised mean difference (95% CI) in quality of life: physical component due to inspiratory muscle training, estimated by pooling data from two studies (n = 56).
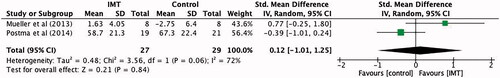
Figure 6. Standardised mean difference (95% CI) in quality of life: mental component due to inspiratory muscle training, estimated by pooling data from two studies (n = 56).
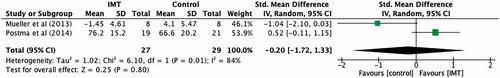
Figure 7. Mean difference (95% CI) in Forced expiratory volume in 1 s (L) due to inspiratory muscle training, estimated by pooling data from four studies (n = 86).
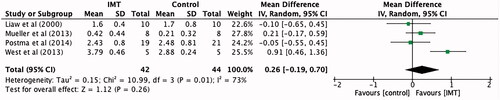
Figure 8. Mean difference (95% CI) in maximal inspiratory pressure due to inspiratory muscle training, estimated by pooling data from six studies, sub-grouped into studies utilizing non-spring-loaded and spring-loaded threshold devices (n = 124).
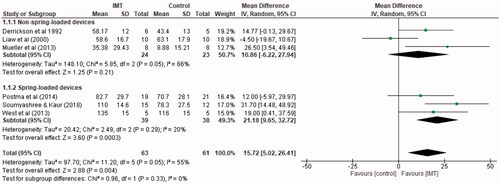
Figure 9. Mean difference (95% CI) in maximal inspiratory pressure due to inspiratory muscle training, estimated by pooling data from four studies, sub-grouped into six and eight week interventions (n = 86).
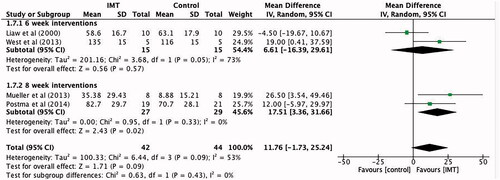
Table 2. Quality of evidence using the GRADE approach (inspiratory muscle training compared to control for adults with spinal cord injuries).
Figure 10. Regression coefficients and 95% confidence intervals to determine lesion- specific MIP and MEP values, using constants developed by Mueller et al. [Citation26].
![Figure 10. Regression coefficients and 95% confidence intervals to determine lesion- specific MIP and MEP values, using constants developed by Mueller et al. [Citation26].](/cms/asset/af24ad45-894e-4649-95d2-14dd11c07b8f/idre_a_2107085_f0010_b.jpg)
Table 3. Example equation to determine lesion-specific MIP value.