
Figures & data
Table 1. Baseline characteristics.
Figure 1. RISE study flowchart [Citation24].
![Figure 1. RISE study flowchart [Citation24].](/cms/asset/03b197e5-0aa3-45fc-a507-743a8a965115/idre_a_2109071_f0001_b.jpg)
Figure 2. Distribution movement behavior pattern groups at baseline, 6 months and 1 year (n = 200).
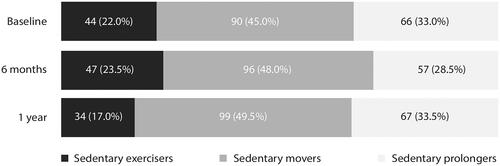
Figure 3. The modelled course of participation during the first year after discharge to the home setting in people with a first-ever stroke per movement behavior pattern at baseline. Abbreviations: SIS Participation: Stroke Impact Scale 3.0 Participation domain. Outcomes are adjusted for the confounding effects of stroke severity (NIHSS), age, sex, symptoms of anxiety (HADS-A) and discharge destination after hospitalization. Note: higher SIS Participation scores indicate better participation outcomes. The error bars represent the standard error (SE). *p < 0.05, comparing mean SIS Participation scores between consecutive time points.
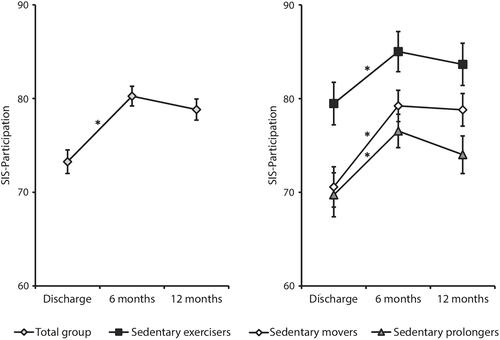
Table 2. Changes in SIS Participation during the first year after discharge across different movement behavior patterns identified directly after discharge to the home setting.
Table 3. The longitudinal association between the course of SIS Participation and the development of movement behavior patterns over time.
Data availability statement
The datasets used and/or analyzed during the current study are available from the corresponding author on reasonable request.