
Figures & data
Figure 1. Image of orthotic shorts.
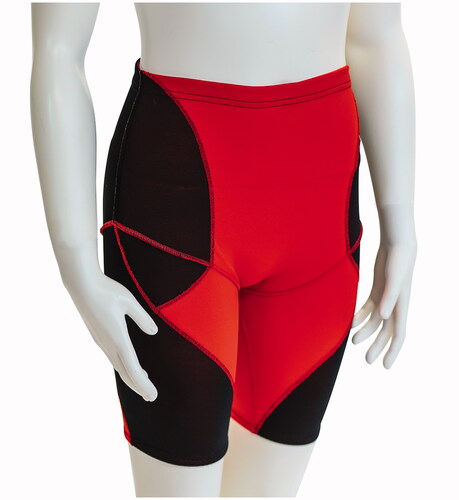
Figure 2. Overview of study design.
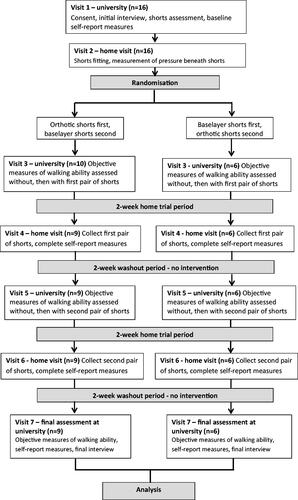
Table 1. The component constructs of the Theoretical Framework of Acceptability [Citation13].
Table 2. Overview of participant characteristics.
Table 3. “No shorts” values at Visits 3, 5, and 7 for spatiotemporal gait parameters that improved during the study.
Table 4. Impact of shorts on self-selected gait speed and spatiotemporal gait parameters.
Table 5. Impact of shorts on trunk and pelvic mediolateral sway.
Table 6. Mean changes and effect sizes for participant-perceived walking ability.
Figure 3. Mean step width compared to normal range in orthotic shorts compared to baseline and baselayer shorts. (Means for normal, non-neurologically impaired people and people with MS are provided for comparison, with 95% confidence intervals (95% CI) for means, using data obtained from Comber et al. [Citation36]. This normal range is shaded. Orthotic shorts test data are missing for Frank, due to heat-induced fatigue during data collection).
![Figure 3. Mean step width compared to normal range in orthotic shorts compared to baseline and baselayer shorts. (Means for normal, non-neurologically impaired people and people with MS are provided for comparison, with 95% confidence intervals (95% CI) for means, using data obtained from Comber et al. [Citation36]. This normal range is shaded. Orthotic shorts test data are missing for Frank, due to heat-induced fatigue during data collection).](/cms/asset/bdf2f1b4-7cd4-409f-8804-ea2854b4a3f3/idre_a_2114018_f0003_c.jpg)
Table 7. Convergent coding matrix for integration of qualitative and quantitative findings.