
Figures & data
Figure 1. Study design. After checking study eligibility and performing a maximal cardiopulmonary exercise test (CPET) during the screening visit, participants performed four 4-day activity regimens [CONTROL, SIT, LIPA (light-intensity physical activity), EX (exercise) regimen] in free-living conditions, followed by a test day to assess outcomes and a wash-out period of 10 days. Habitual physical activity levels were maintained during the CONTROL regimen and manipulated as indicated during the subsequent regimens. The order of the SIT and LIPA regimen was randomised.
![Figure 1. Study design. After checking study eligibility and performing a maximal cardiopulmonary exercise test (CPET) during the screening visit, participants performed four 4-day activity regimens [CONTROL, SIT, LIPA (light-intensity physical activity), EX (exercise) regimen] in free-living conditions, followed by a test day to assess outcomes and a wash-out period of 10 days. Habitual physical activity levels were maintained during the CONTROL regimen and manipulated as indicated during the subsequent regimens. The order of the SIT and LIPA regimen was randomised.](/cms/asset/59c8fced-25f0-4943-9386-95ec6caf58d8/idre_a_2122601_f0001_b.jpg)
Figure 2. Flow chart of study participants.
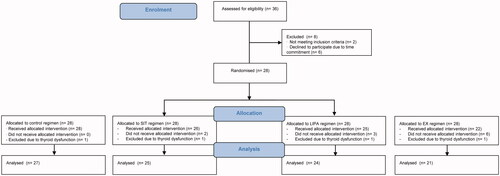
Table 1. Subject characteristics (n: 28).
Table 2. Physical activity during the activity regimens.
Figure 3. Two-hour oral glucose tolerance tests. (A,C) Average insulin and glucose levels per time point of the 2-h oral glucose tolerance test per activity regimen (
 SIT,
SIT,  LIPA,
LIPA,  EX). (B,D) Total area under the curve (tAUC) for insulin and glucose concentrations shown in (A,C). Data are presented as estimated means ± SEM. LIPA: light-intensity physical activity; EX: exercise. #Trend towards significant difference (p = 0.054 at 45 min for SIT vs. LIPA, p = 0.063 at 60 min for SIT vs. EX). All analyses were Bonferroni corrected.
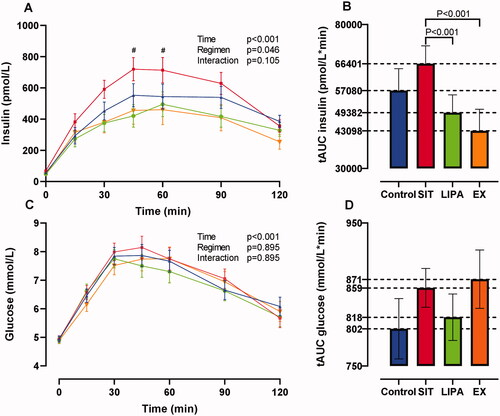
Table 3. Cardiometabolic health outcomes.