
Figures & data
Figure 1. Enrollment flow diagram.
a flow diagram chart showing the number of patients excluded, and displaying the final number of patients in each treatment group.
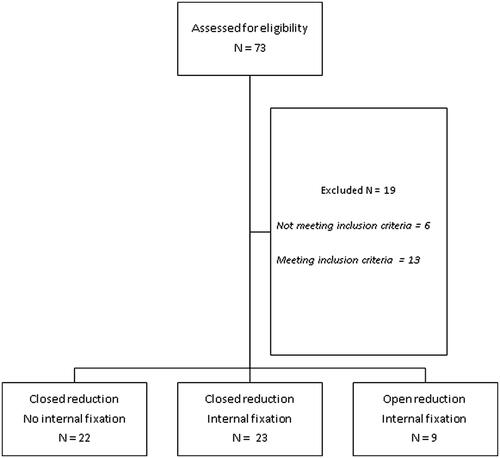
Table 1. Overview of the study population according to fracture type.
Figure 2. Percentage of children experiencing a specific symptom at T1, T2, and T3.
a series of 7 bar charts representing the percentage of children experiencing each post-traumatic symptom, clustered in three bars representing the measurement sessions at 6 weeks (dark blue), 3 months (medium blue) and 6 months (light blue) post-trauma.
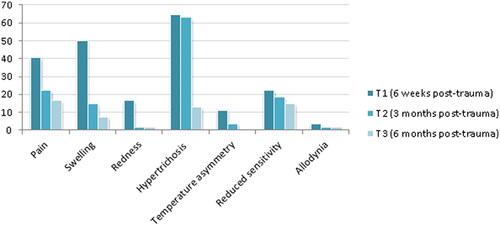
Table 2. Range of motion and dexterity of affected versus unaffected side.
Table 3. Variables of influence on recovery of ROM and dexterity over time.