
Figures & data
Figure 1. Flowchart of the inclusion.
The text in this figure explains how patients have been include and how and why some have been excluded from the study.
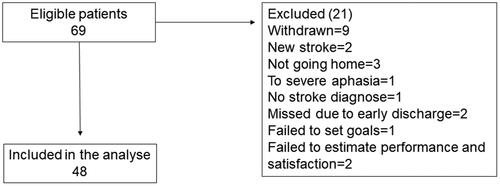
Table 1. Characteristics of the study population, and comparisons with those excluded from the study.
Table 2. Patient goals categorized by themes.
Figure 2. A Sankey diagram showing the changes in the rate of performance for each goal between enrolment and discharge from the VESD team.
This figure shows how the patients rated between 1 and 10 their performance of the activity they have identified in their goals at enrolment to the rehabilitation with the VEDS team and at discharge from the team. A line is drawn between the various scores from enrolment to discharge. Each score at enrolment has a different color and by following the colored line, you can see how the patient has rated at discharge.
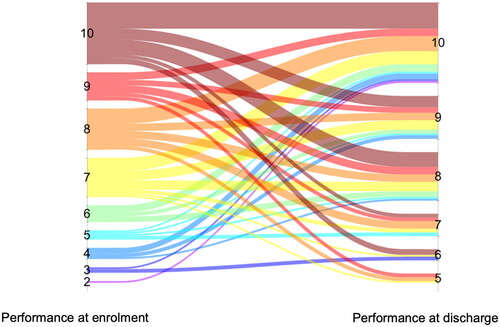
Figure 3. A Sankey diagram showing the changes in the rate of satisfaction, for each goal, between enrolment and discharge from the VESD team.
This figure shows how the patients rated between 1 and 10 their satisfaction with their performance of the activity they have identified in their goals at enrolment to the rehabilitation with the VEDS team and at discharge from the team. A line is drawn between the various scores from enrolment to discharge. Each score at enrolment has a different color and by following the colored line, you can and see how the patient has rated at discharge.
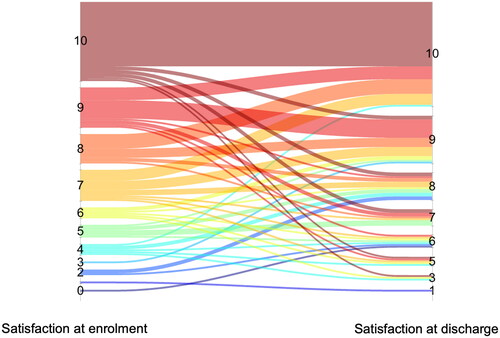
Table 3. Patient-identified rehabilitation goals linked to the ICF framework using link rules for meaningful concepts.