
Figures & data
Table 1. Demographic sample characteristics.
Table 2. Number of the participants’ main primary ICD-10 F-diagnoses.
Table 3. Factor loadings and communalities (h2) for the test and questionnaire data.
Figure 1. Factor score profile of claimants for disability benefits and applicants for early retirement. Claimants for disability benefits (blue bars) exhibited higher scores in the factor FaPsy Limitations in Psychosocial Capacity, as obtained from the psychiatric ratings, and in Behavioral Dysfunction (Fa3), as well as lower scores in the factors Self-Perceived Work Ability (Fa2), Working Memory (Fa4), and Cognitive Processing Speed (Fa5), as compared to applicants for early retirement (red bars). The two groups did not vary in Negative Affectivity (Fa1) and Excessive Work Commitment (Fa6). Significant group differences are marked by the dashed boxes.
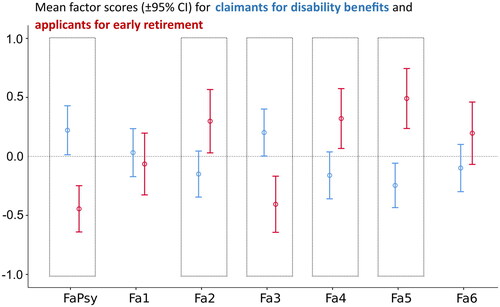
Figure 2. Factor score profile of claimants with different psychiatric diagnoses. Participants with F6x diagnoses (brown bars) exhibited higher scores FaPsy Limitations in Psychosocial Capacity, Negative Affectivity (Fa1), and Behavioral Dysfunction (Fa3), as compared to participants with F3x and F4x diagnoses (green and yellow bars, respectively). The groups did not vary in Self-Perceived Work Ability (Fa2), Working Memory (Fa4), Cognitive Processing Speed (Fa5), and Excessive Work Commitment (Fa6).
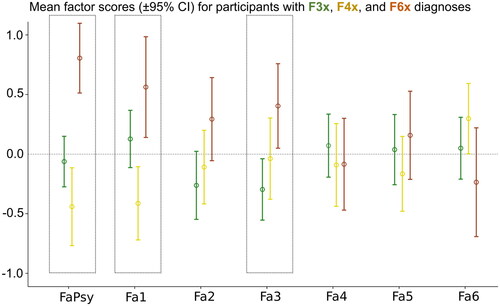
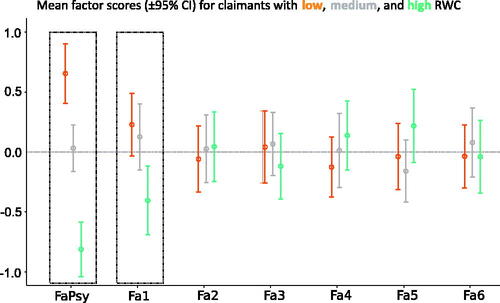
Figure 3. Factor score profile of claimants for disability benefits with different levels of RWC. Claimants with different levels of RWC showed significant differences in the factor FaPsy Limitations in Psychosocial Capacity, as obtained from the psychiatric ratings, and the factor 1 (Fa1) Negative Affectivity. They did not vary in the factors Self-Perceived Work Ability (Fa2), Behavioral Dysfunction (Fa3), Working Memory (Fa4), Cognitive Processing Speed (Fa5), and Excessive Work Commitment (Fa6).
Supplementary Material.docx
Download MS Word (268.4 KB)Data availability statement
The datasets generated and analyzed during the current study are not publicly available due to data protection reasons. Coded data might be selectively available from the senior author (RM) upon reasonable request.