Figures & data
Table 1. Demographic characteristics, clinical variables in ABI, study participants (n = 1,745), and risk of bias.
Figure 1. Preferred reporting item for systematic review and meta – analysis flow chart study selection.
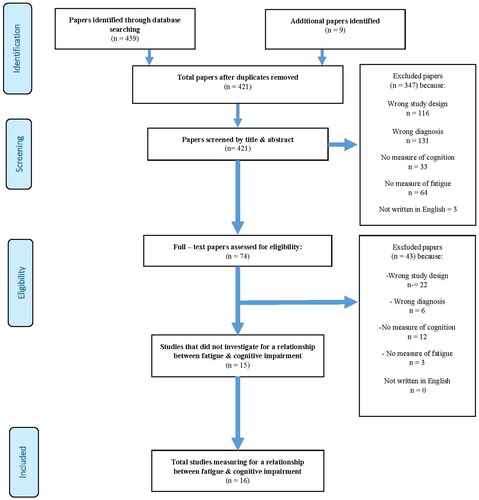
Table 2. Study details and overall findings.
Table 3. Fatigue scales and dimensions assessed.
Figure 2. Forest plot displaying reaction time scores in Pearson’s r and relationship between cognitive measures/fatigue scales.
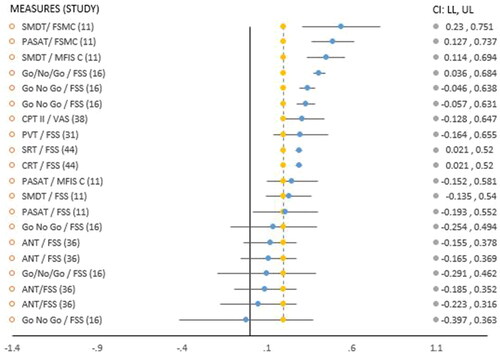
Table 4. Summary of domain specific comparisons made, associations found, rate of positivity (%).
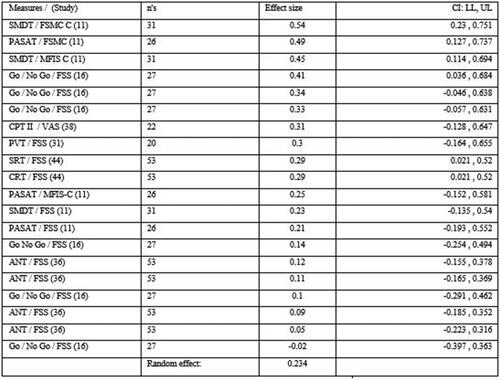
Figure 3. Meta-analysis effect size in Pearson’s r.
Figure 2 &3, Abbreviations of cognitive assessments: SMDT: Symbol Digit Modalities Test; PASAT: Paced Auditory Serial Addition Test; CPT II: Continuous Performance Test II; PVT: Psychomotor Vigilance Task; SRT: simple reaction time; CRT: choice reaction time; ANT: Attention Network Test. Abbreviations of fatigue measures: FSMC – C: Fatigue Scale of Motor and Cognition – cognitive subscale; MFIS – C: Modified Fatigue Impact Scale, cognitive subscale; VAS: Visual Analog Scale; FSS: Fatigue Severity Scale. : Positive threshold target (yellow vertical line), 0.2.