
Figures & data
Table 1. Hypotheses formulated a priori to assess the responsiveness of the FIM scale in older adults with hip fracture.
Table 2. Clinical characteristics of older adults with hip fracture included in the study (n = 701).
Figure 1. ROC curves of the FIM total (A) and motor (B) score considering the MCID of the BI, the FAC score, and the checklist question as anchors. ROC shows the overall accuracy of the FIM in identifying an improvement in the level of independence in individuals with hip fracture according to the three anchors. (A) For the total score, the AUCs (95% C.I.) were 0.82 (0.78 − 0.86) when the MCID of the BI was used as an anchor, 0.81 (0.78 − 0.85) when cut-off of 3 of the FAC score was the anchor, 0.85 (0.81 − 0.87) for the checklist on independence in performing transfers. (B) For the motor score, the AUCs (95% C.I.) were 0.83 (0.79 − 0.87) when the MCID of the BI was used as an anchor, 0.82 (0.79 − 0.85) when cut-off of 3 of the FAC score was used, 0.86 (0.83 − 0.89) for the checklist on independence in performing transfers.
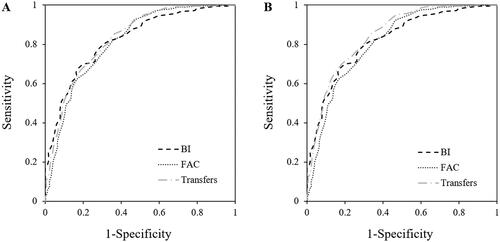
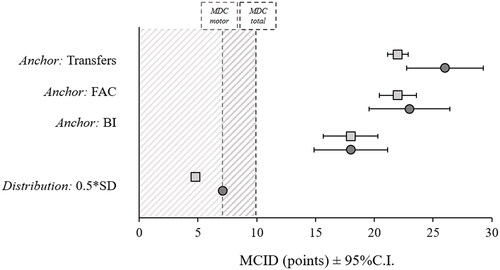
Figure 2. MCID for the FIM total and motor score using both anchors- and distribution-based methods. The dark grey circles represent the MCID of the FIM total score, while the light grey square the MCID of the FIM motor score. The dark and light grey dashed lines represent the minimum detectable change (MDC) of the total (10.3 points) and the motor (7.7 points) FIM score, respectively.
Supplemental Material
Download MS Word (15.4 KB)Data availability statement
The data that support the findings of this study are available from the corresponding author, MG, upon reasonable request.