
Figures & data
Figure 1. Schematic of student mentor responses to Disability Discomfort Scale questionnaire across stepped wedge design. Each ‘step’ is 3 months in duration. There are 8 assessment points (T0 to T7) and assessments occur at the start of each new step. Light shading represents the control period. Dark shading represents the intervention period. Data were not collected from student mentors at T0.
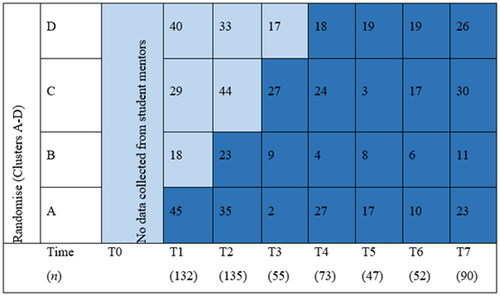
Figure 2. Flow of student mentors through the trial.
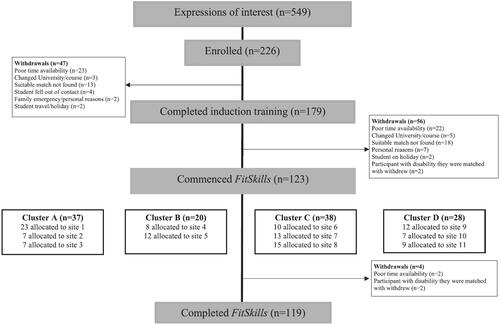
Table 1. Baseline characteristics of student mentors who consented to complete the disability discomfort scale (n = 207).
Figure 3. Box plots with jitter plots (using small random jitter variation) of Time (x-axis) vs. Discomfort Scale scores (y-axis) shown in separate panels for Clusters 1 to 4. In each boxplot, the bottom and top edges indicate the 25th and 75th percentiles respectively. The line within each box indicates the median Discomfort Scales score. The whiskers extend to 1.5 times the interquartile range to the most extreme scores. Scores lying beyond the whiskers are outliers (red crosses). Cluster 1 was exposed to the intervention at T1, Cluster 2 at T2, Cluster 3 at T3 and Cluster 4 at T4.
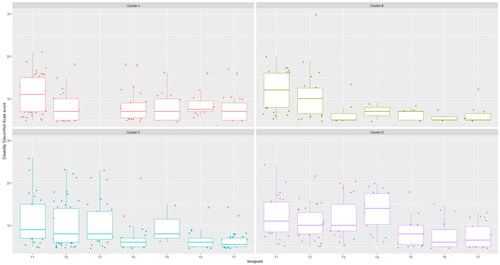
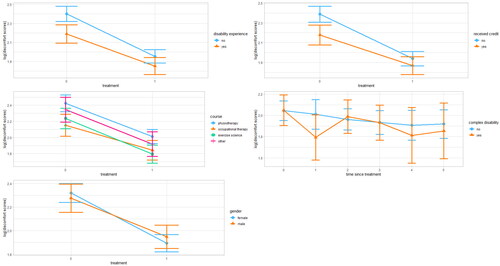
Figure 4. Interaction plots between some considered moderators and their effects on predicted values of the outcome variable (log of discomfort scores) when passing from control (treatment/time since treatment = 0) to immediately after treatment (time since treatment = 1) and subsequent 3-month interval follow-ups. The bars on either extreme are 95% confidence intervals.
Data availability statement
The data that support the findings of this study are available from the corresponding author upon reasonable request.