Figures & data
Table 1. Demographic and clinical characteristics of participants (n = 50).
Table 2. Descriptive data of the AC, ACS-NL(18-64) and the OBQ11-NL at T1 and T2.
Figure 1. Bland-Altman plot of the difference of scores against the mean scores of the AC- average total day score (n = 50). The solid line represents the mean of differences (-1.22). The two dashed lines define limits of agreement (đ ± 1.95*SD = -8.93 - 6.5.
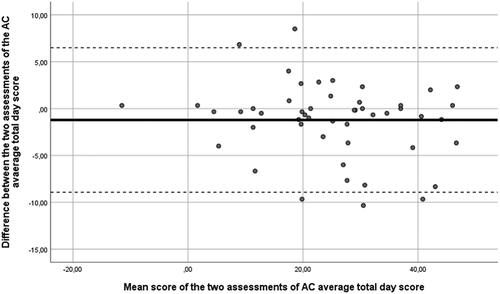
Figure 2. Bland-Altman plot of the difference of scores against the mean scores of the ACS-NL(18-64)-percentage retained activities scores (n = 50). The solid line represents the mean of differences (1.43). The two dashed lines define limits of agreement (đ ± 1.95*SD = -6.91 - 9.77).
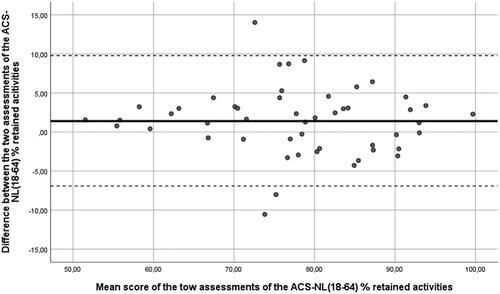
Table 3. Test-retest reliability of the Activity Calculator (AC), Activity Card Sort-NL (18–64) and OBQ11-NL.
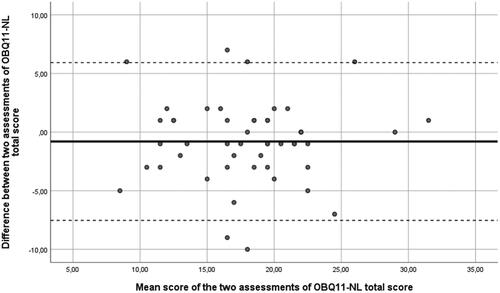
Figure 3. Bland-Altman plot of the difference of scores against the mean scores of the OBQ11-NL (n = 50). The solid line shows the mean absolute difference (-0.80), while the two dashed lines show the absolute limits of agreement: (đ ± 1.95*SD = -7.53–5.93).