Figures & data
Figure 1. Flow chart of the participants in this study.
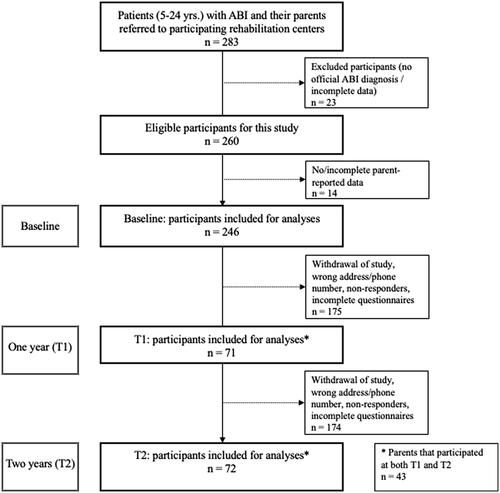
Table 1. Demographic, injury, and family characteristics in children, adolescents, and young adults with TBI/nTBI, referred to outpatient rehabilitation, at baseline.
Table 2. Differences in parent reported family impact and patients’ Health related quality of life between patients with TBI and nTBI at baseline and one and two years later.
Table 3. Parent-reported family impact over the course of time.
Table 4. Parent-reported Health-Related Quality of Life (HRQoL) for their child over the course of time.
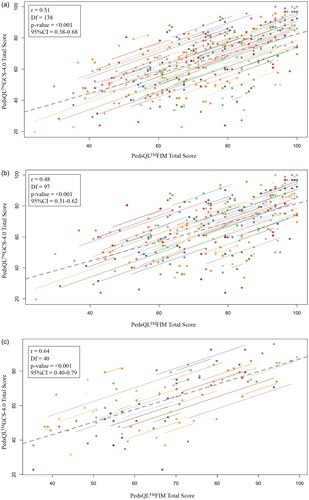
Figure 2. (a) Longitudinal correlation between Family impact (PedsQL™FIM) and HRQoL (PedsQL™GCS-4.0) in the total group. LEGEND: PedsQL™FIM: Pediatric Quality of Life Inventory™Family Impact Module. PedsQL™GCS-4.0: Pediatric Quality of Life Inventory™Generic Core Scales-4.0. * Correlation coefficient (r): very strong = > 0.8; moderately strong = 0.6 to 0.8; fair = 0.3 to 0.5; and poor = < 0.3. # p-value <0.05 = statistically significant. Df: Degrees of freedom, 95%CI = 95% Confidence Interval. Analyses were corrected for age and sex. (b) Longitudinal correlation between Family impact (PedsQL™FIM) and HRQoL (PedsQL™GCS-4.0) in the TBI group. LEGEND: PedsQL™FIM: Pediatric Quality of Life Inventory™Family Impact Module. PedsQL™GCS-4.0: Pediatric Quality of Life Inventory™Generic Core Scales-4.0. TBI: Traumatic brain injury. * Correlation coefficient (r): very strong = > 0.8; moderately strong = 0.6 to 0.8; fair = 0.3 to 0.5; and poor = < 0.3. # p-value <0.05 = statistically significant. Df: Degrees of freedom, 95%CI = 95% Confidence Interval. Analyses were corrected for age and sex. (c) Longitudinal correlation between Family impact (PedsQL™FIM) and HRQoL (PedsQL™GCS-4.0) in the nTBI group. LEGEND: PedsQL™FIM: Pediatric Quality of Life Inventory™Family Impact Module. PedsQL™GCS-4.0: Pediatric Quality of Life Inventory™Generic Core Scales-4.0. nTBI: Non-traumatic brain injury. * Correlation coefficient (r): very strong = > 0.8; moderately strong = 0.6 to 0.8; fair = 0.3 to 0.5; and poor = < 0.3. # p-value <0.05 = statistically significant. Df: Degrees of freedom, 95%CI = 95% Confidence Interval. Analyses were corrected for age and sex.