
Figures & data
Figure 1. Schematic representation of the study design and procedures. Footnote to Figure 1. Short questionnaire measured the following items: patient-specific function, pain intensity, and psychological factors (bothersomeness, fear beliefs, knee confidence, pain control and pain catastrophising). Long questionnaires measured the following items: disability and pain (Knee injury and Osteoarthritis Outcome Scale using the daily living and pain sub-scales), and psychological factors including, fear beliefs (Knee Osteoarthritis Fears and Beliefs Questionnaire), Pain control (Brief Pain Coping Inventory-2), and Pain catastrophising (pain catastrophising scale). Functional tests included: 40m fast-paced walk test (Wright et al 2011), and a 30 second chair stand test (Jones et al 1999). Both functional tests are OARSI guideline recommended (Dobson et al 2013).
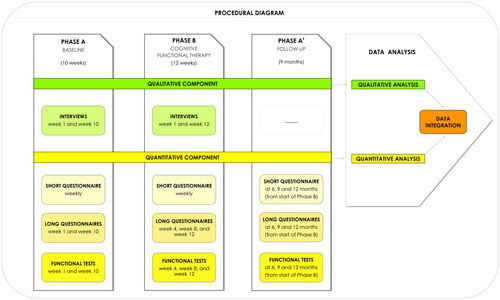
Table 1. Multidimensional factors and cognitive functional therapy (CFT) management for the four clinical cases.
Table 2. Process of change for each participant.
Figure 2. Patient-specific function and pain intensity. Simulation Modeling Analysis for significant change between baseline and treatment period over the course of the intervention (correlation of data stream with phase vector and respective p-values for patient-specific function and pain intensity). Significant values are displayed in bold. Footnote to Figure 2. NRS: Numerical Rating Scale.
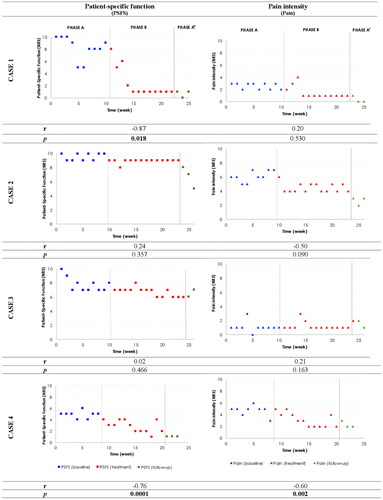
Table 3. Patient self-reported outcome measures and functional tests across the three phases of the study.
Figure 3. Process of change based on the Common Sense Model, for people with knee osteoarthritis undergoing CFT.
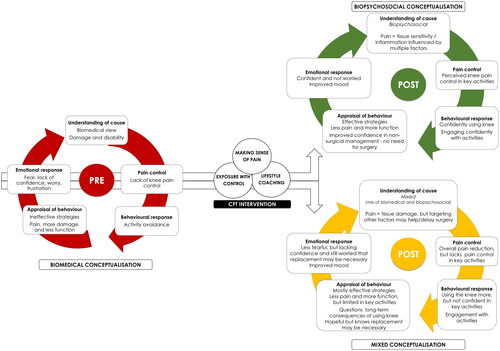
Table A1. Participants’ characteristics.
Table A2. Pain-related psychological factors.
Supplemental Material
Download MS Word (56.6 KB)Data availability statement
Data for the four participants of this study is embedded in the manuscript and individually presented either in a graphic or table format.