
Figures & data
Figure 1. PRISMA flow chart.
Chart showing publication selection process.
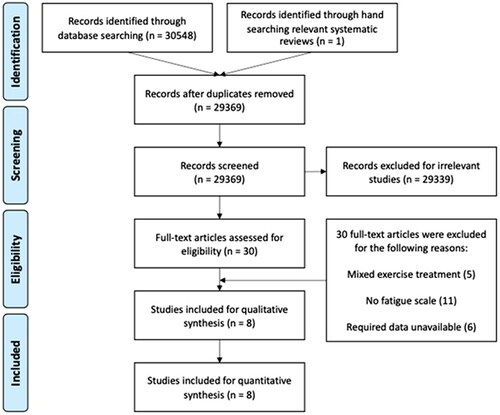
Table 1. Characteristics of population and interventions of included studies.
Figure 2. FACIT-F Forest Plot [above zero favours RT; below zero favours control].
Plot illustrating study effect sizes and overall mean effect size for FACIT-F.
![Figure 2. FACIT-F Forest Plot [above zero favours RT; below zero favours control].](/cms/asset/c7732972-4e22-43c8-a811-0747ffbbb0b8/idre_a_2226408_f0002_b.jpg)
Figure 3. FACIT-F Heterogeneity.
Table illustrating study variation in outcomes for FACIT-F.
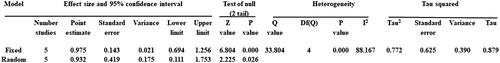
Figure 4. FACIT-F Sensitivity analysis [above zero favours RT; below zero favours control].
Plot illustrating the effects of leaving one study out a time on the outcome.
![Figure 4. FACIT-F Sensitivity analysis [above zero favours RT; below zero favours control].](/cms/asset/5b98d286-086c-4e42-9bc6-e9bcfb594c60/idre_a_2226408_f0004_b.jpg)
Figure 5. PFS-R Forest Plot [below zero favours RT; above zero favours control].
Plot showing study effect sizes and overall mean effect size for PFS-R.
![Figure 5. PFS-R Forest Plot [below zero favours RT; above zero favours control].](/cms/asset/52b41cf4-ec09-40ff-9dea-28c63646001c/idre_a_2226408_f0005_b.jpg)
Figure 6. PFS-R Heterogeneity.
Table illustrating study variation in outcomes for PFS-R.
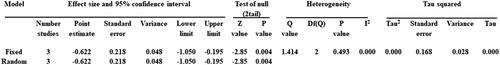
Figure 7. PFS-R Sensitivity analysis [below zero favours RT; above zero favours control].
Plot showing the effects of leaving one study out at a time on the outcome.
![Figure 7. PFS-R Sensitivity analysis [below zero favours RT; above zero favours control].](/cms/asset/f54a2120-c562-4254-8084-f5c0f2b77523/idre_a_2226408_f0007_b.jpg)
Table 2. Methodological quality assessment [PEDro].