
Figures & data
Figure 1. Study design. Measurements are performed at the start of the training period (January, T1); after the training period, prior to the event (June, T2); and follow-up, four months after the event (October, T3) and one year after the event (June, T4). abbreviations: GXT = graded exercise test, POpeak = peak power output, VO2peak = peak oxygen uptake.
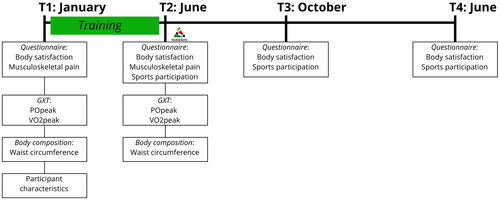
Table 1. Characteristics and outcomes at T1 for participants and non-participants.
Table 2. Descriptive data and outcome measures of participants at all time points.
Table 3. Longitudinal trajectory of body satisfaction (N = 143).
Figure 2. Longitudinal trajectory of functional satisfaction (A) and appearance satisfaction (B) for different Subgroups. A1, B1 = sex: M/F. A2, B2 = waist circumference at T1: healthy (men ≤ 102 cm, women ≤ 88 cm) and unhealthy (men > 102 cm, women > 88 cm). A3, B3 = handcycling classification as a proxy for severity of the impairment: H1-H3 (most impaired)/H4-H5 (least impaired). T1 = start of the training period. T2 = after the training period, prior to the HandbikeBattle event. T3 = follow-up measurement, four months after the event. T4 = follow-up measurement, one year after the event.
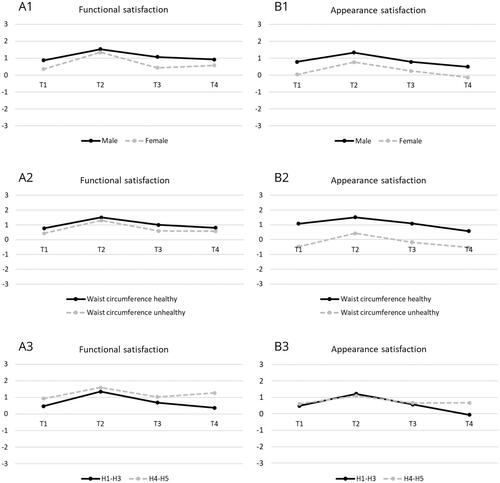
Table 4. Longitudinal trajectory of body satisfaction of groups with different sex, waist circumference or handcycling classification and interaction effects (time * group).
Table 5. Longitudinal and cross-sectional associations between physical capacity or body composition and body satisfaction during the training period (T1–T2).
Data availability statement
The data that support the findings of this study are available from the corresponding author, IK, upon reasonable request.