Figures & data
Table 1. Risk criteria for PTSD or pain.
Table 2. Intervention design, consistent with the TIDieR checklist.
Figure 1. Participant inclusion flow chart.
*Note. Some patients met multiple exclusion criteria, LTFU indicates participants completely lost to follow up from the respective time-point; + exclusion of patients aged 65 years and older injured in low falls was introduced in March 2020.
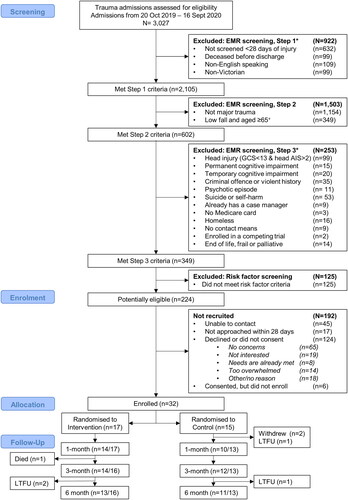
Table 3. Sample characteristics at baseline.
Table 4. Intervention processes, N = 17.
Figure 2. Willingness for treatment for mental health or pain symptoms, 95% confidence intervals estimated with 100 bootstrapped samples.
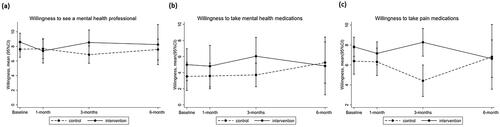
Figure 3. Percentage of participants satisfied or very satisfied with treatment over time.
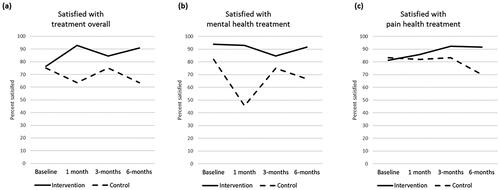
Figure 4. PCL-C scores for the control and intervention group over time in all participants, and in participants with high baseline PTSD symptoms.
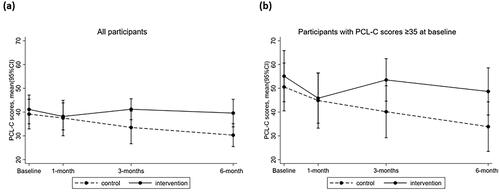
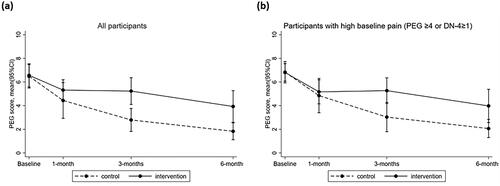
Figure 5. Pain (PEG) scores between the control and intervention group over time in all participants, and participants with higher baseline symptoms.