
Figures & data
Figure 1. Schematic representation of data-analysis.
Two parallel paths including initial coding, axial coding and defining subthemes for both child and parent interviews. Both paths comes together in a box overarching themes.
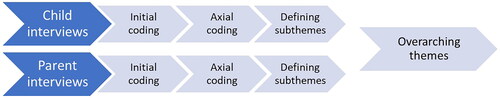
Table 1. Characteristics of participants.
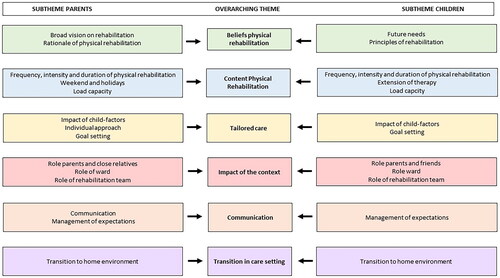
Figure 2. Overview of themes and subthemes.
A three-column scheme with in the left column subthemes from parent interviews, in the right column subthemes from child interviews and in the centre the overarching main themes.
Supplemental material