Figures & data
Figure 1. A model for understanding EMD risk and the adverse outcomes of EMD expression over the course of an individual’s lifetime.
A four-panel model linked through double-headed arrows to show interconnected domains relevant to understanding EMD risk. Each panel holds a domain, presented from left to right as list of Impairments, Activity Limitations, Disease Expression and Outcomes.
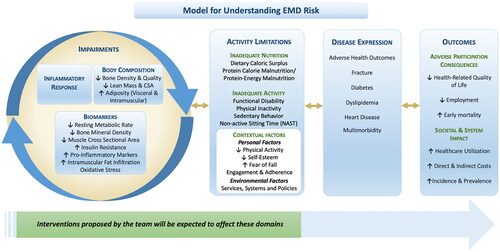
Figure 2. An overview of the RIISC team’s roadmap to successful amelioration of EMD risk.
A five-panel model showing the RIISC team’s sequence of strategies to ameliorate EMD risk. From left to right, the panels list Baseline characteristics of populations (first), primary prevention/community health promotion (second), metrics (third), secondary prevention/rehabilitation (fourth) and outcomes (fifth).
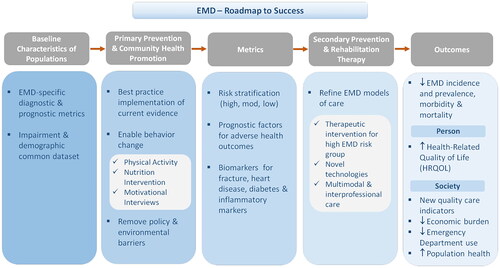
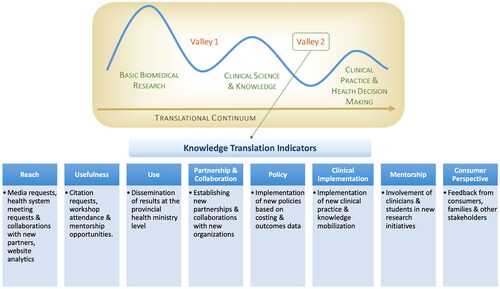
Figure 3. RIISC team’s knowledge translation indicators of success. (clinical translational continuum modified from steven reis, University of pittsburgh and harold pincus, columbia University and knowledge translation indicators modified from the University of Toronto, department of Medicine academic Strategic plan 2011–2016).
A two-part figure. Above, a wave graph adapted from Steven Reis Clinical Translational Continuum. It shows Basic Biomedical Research, Clinical Science & Knowledge, and Clinical Practice & Health Decision Making as three decreasing wave peaks separated by two valleys over a rightward arrow. Below, an eight-panel model showing a list of knowledge translation indicators of success including, from left to right, Reach, Usefulness, Use, Partnership & Collaboration, Policy, Mentorship and Consumer Perspective.