
Figures & data
Table 1. Example search for CINAHL database.
Figure 1. PRISMA flowchart.
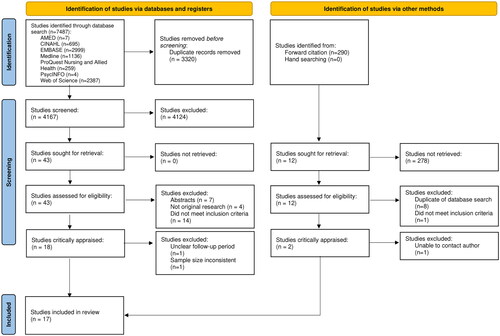
Table 2. Summary of study designs and outcomes of included studies.
Table 3. Summary demographic characteristics of included studies.
Figure 2. Proportionate mortality at 1-, 3-, and 5-years after partial foot amputation (random effects meta-analysis).
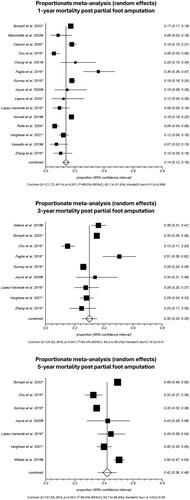
Table 4. Proportionate mortality reported in different systematic reviews.
Figure 3. Updated proportionate mortality at 1-, 3-, and 5-years after partial foot amputation (random effects meta-analysis) including data from this review and preceding review [Citation5].
![Figure 3. Updated proportionate mortality at 1-, 3-, and 5-years after partial foot amputation (random effects meta-analysis) including data from this review and preceding review [Citation5].](/cms/asset/3ce611a4-0ddc-4fa3-8751-5461858022e8/idre_a_2355988_f0003_b.jpg)
Supplemental material
Supplemental Material
Download Zip (135.6 KB)Data availability statement
The authors confirm that the data supporting the findings of this study are available within the article and its supplementary materials.