
Figures & data
Table 1. Traditional program vs. hybrid program.
Figure 1. Consort flow diagram of participants throughout the analysis. Patient enrollment at visit 1 and dropout across seven phases in the program, assessed every five visits until program completion at visit 30. A total of 100 participants enrolled out of 192 referred and 35 completed the program. Reasons for dropout included failure to return after evaluation, electing to discontinue, insurance change, prolonged gap in attendance, return to work, COVID, hospitalization, cardiac surgery, and transfer to another clinic.
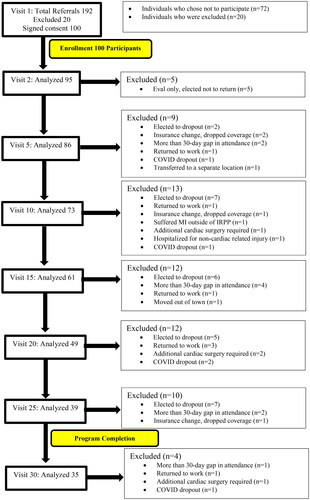
Table 2. Subjective questionnaire and physical performance test reliability and validity.
Table 3. IRPP four-part treatment details.
Figure 2. Cardiac testing template (CTT) of physical performance tests 1–4. Graphs are coordinated with the above numeric data, using the average data for visit 30 from the present study. Recommended universal language template for reporting treatment data to physicians and insurance providers. Peak HR: peak heart rate; Rec HR: 1-minute recovered heart rate; AHRI%: achieved heart rate intensity; HRR%: heart rate recovery; IR%: total intensity recovery; 6MW: 6-minute walk; STS: 1-minute sit-to-stand; ST: 1-minute step; AST: 1-minute agility square test. Heart rate graph during the objective tests of 6-minute walk, sit to stand, step, and agility square tests. Left columns show name, date, age, height, weight, vitals, and normative six-minute walk score. Center columns show colored target heart rate zones including 30% (white), 40% (purple), 50% (grey), 60% (blue), 70% (green), 80% (yellow), 90% (red), and 100% (black). Right columns show numeric test results along with peak heart rate, recovered heart rate, achieved heart rate intensity %, heart rate recovery %, and total intensity-recovery %. Results colored green and red to show if recovery goals were successfully met.
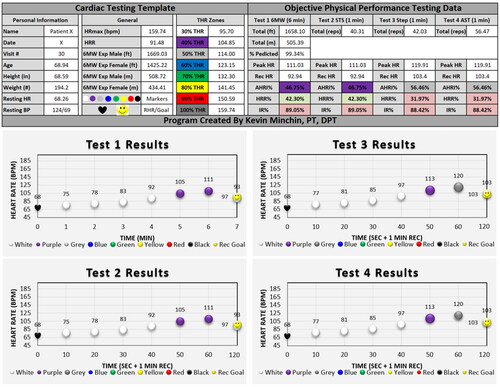
Table 4. Intensity recovery progression protocol (IRPP) to determine progression/regression. (Achieved Heart Rate Intensity (AHRI%), Heart Rate Recovery (HRR%), Intensity Recovery (IR%))
Table 5. Participant characteristics.
Table 6. Between group and within group analysis using means, standard deviations (SDs), and 95% confidence intervals (CI) for the baseline, visit 15, and visit 30 outcome measures.