Figures & data
Table 1. Functional ability profile of children with CP.
Table 2. Mean, range and standard deviation (SD) chronological age, non-verbal age, and language age equivalent for each group.
Table 3. Distribution of performance on functional gaze control tasks.
Table 4. The mean, standard deviation (SD) and range of scores on the joint attention and social responsiveness tasks by group.
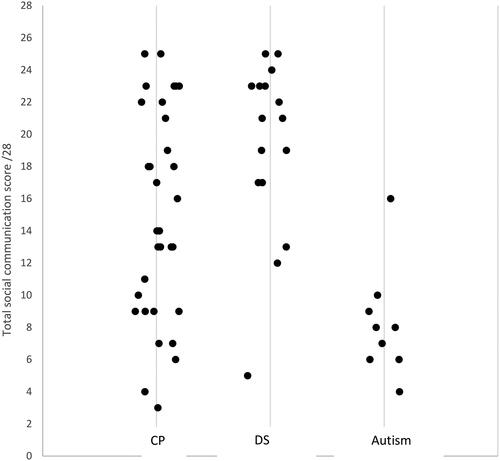
Figure 1. The mean social communication score by group (CP, DS, autism)*.
*A jittered scatter plot is presented to represent overlapping data points.
Scatter plot showing distribution of social communication scores. CP group scores are spread across the full range of possible scores. DS group scores are high. Autism group scores are low.