
Figures & data
Table 1. Family caregiver demographics.
Table 2. Resident demographics (reported by family caregivers).
Figure 1. Family caregivers’ methods of providing hearing support to residents with dementia. Note. “Other” responses included: “flashing phone light.” Additional open-ended responses clarified “communication techniques” as: “eye contact and speaking louder,” “speak more clearly” and “hand gestures that mirror the word I’m trying to convey.”
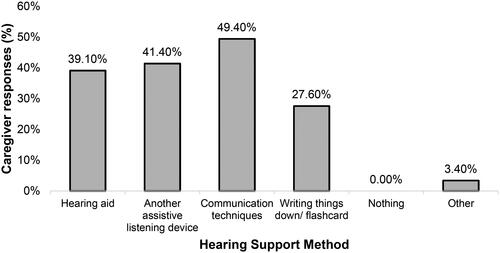
Figure 2. Reasons given for incorrect use of hearing aids by residents with dementia. Note: Open-ended “Other” responses (4.6%) included “mum wouldn’t cope with placing a hearing aid” and “sometimes, even with hearing aids, it is difficult to communicate.”
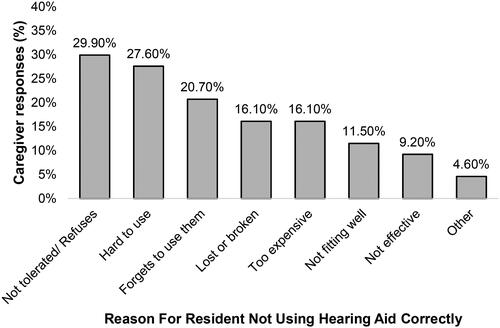
Figure 3. Box-and-Whisker plot displaying the distribution of the scores for the six COM-B domains. The Central black line shows the median score for each domain, the grey box encompasses the interquartile range (IQR) and the whiskers display the range of responses. There is one outlier for the domain Psychological Capability, which is not influential.
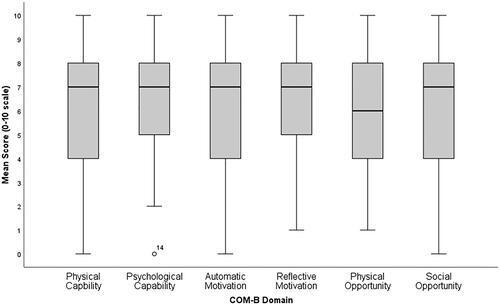
Table 3. Summary of key findings: survey COM-B domain scores, additional survey findings, prominent TDF domains, themes, intervention functions, exemplar interventions.