
Figures & data
Figure 1. Theoretical model for the relationships between sensory processing, motor coordination, executive functions, sleep quality, and organization-in-time abilities and emotional responses.
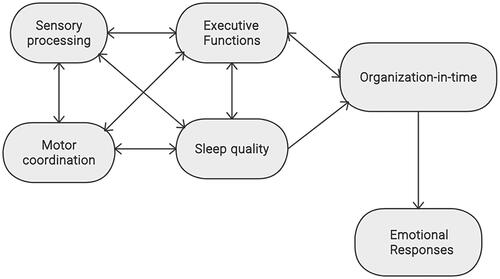
Figure 2. Theoretical model representing latent and observed variable.
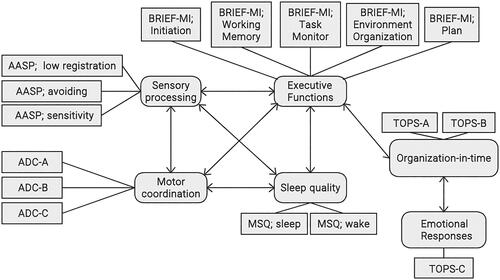
Table 1. Descriptive statistics by group.
Table 2. MANOVA for questionnaire domains.
Table 3. Frequencies of deficient function in organization-in-time domains, sensory processing, motor coordination, Executive functions, and sleep quality per cutoff points, norms, or mean final scores by group.
Table 4. Observed variable loadings with latent variables by group.
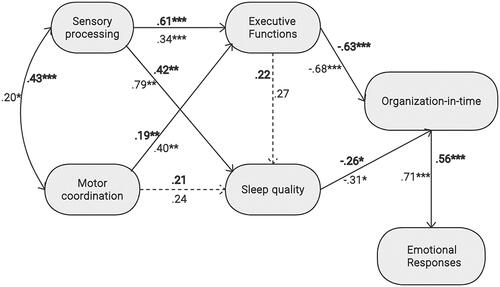
Figure 3. Structural equation model: relationships and regression coefficients between organization-in-time and emotional responses and between these variables and executive functions, sensory processing, motor coordination, and sleep quality.
Data availability statement
The data that support the findings of this study are available on request from the corresponding author [SR]. The data are not publicly available because they contain information that could compromise the research participants’ privacy.