
Figures & data
Figure 1. Flowchart of the machine learning approach.
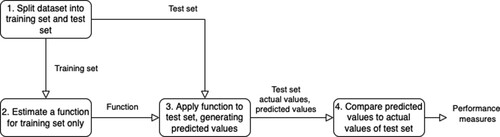
Figure 2. Timeline of the research design.
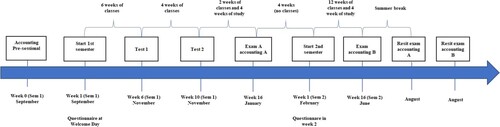
Figure 3. Flowchart of the sample.
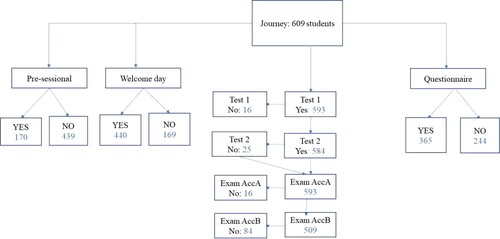
Table 1. Frequency table: outcome split by gender, probability of success and pre-sessional attendance.
Table 2. Descriptives and group means depending on outcome (A = Drop-out, B = Repeat Year, C = Pass).
Table 3. Testing with χ2 and ANOVA if the three outcome groups have statistically different proportions (χ2) or levels (ANOVA) in the respective variables.
Table 4. Machine learning using the classification method random forest.
Table 5. Classification Table with actual and predicted outcome.
Table 6. Ordered Logistic regression on total sample.