Figures & data
Figure 1. Conceptual model of resilience illustrating example aspects associated with each framework.
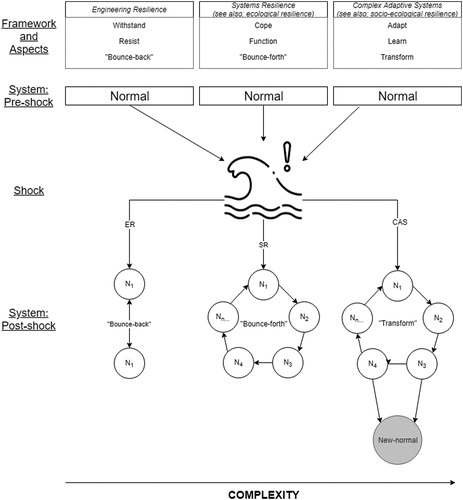
Figure 2. Objective search process for identifying flood resilience.
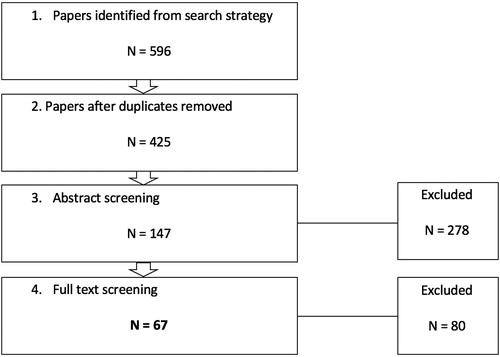
Table 1. Inclusion/exclusion criteria.
Figure 3. Resilience papers published annually, 1998 – 2017.
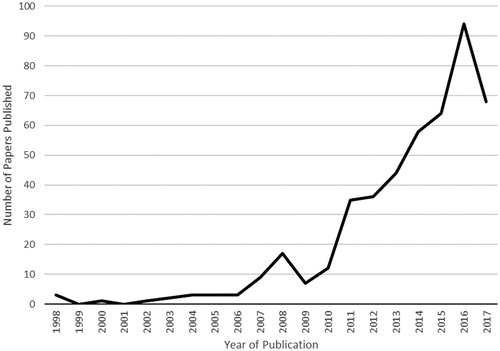
Figure 4. TagCloud highlighting resilience aspects used in definitions (Numbers next to aspects represent the number of times each aspect was cited across the 56 definitions used in database).
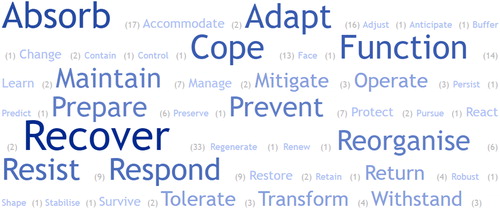
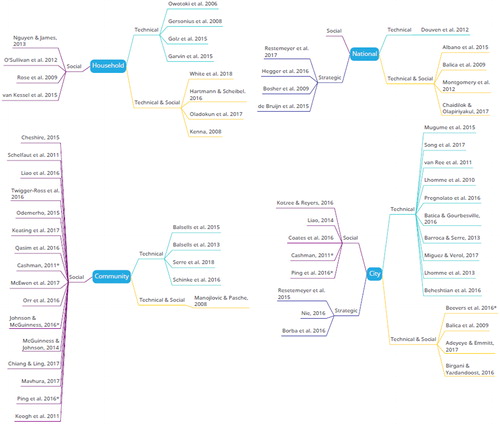
Figure 5. Papers associated with the three resilience frameworks. Asterisk denotes that which state recovery in their definition without differentiating between short or long term recovery. van Ree et al. (Citation2011) have been excluded as their definition only included the recovery aspect with no temporal indication, and therefore could not be situated on the spectrum.
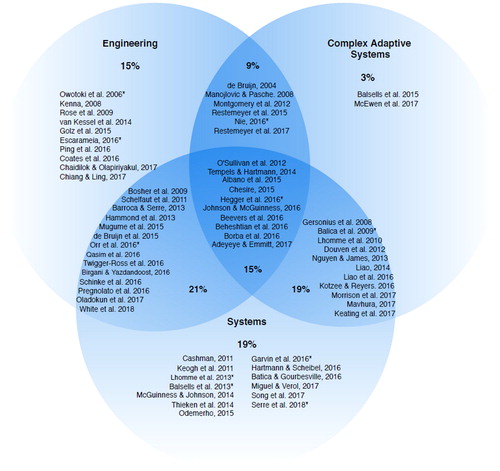
Table 2. Classification of resilience methods (asterisk next to source denotes studies that are in review format).
Figure 6. Papers classified depending on spatial scale of analysis and perspective adopted. (Those marked with an asterisk attempt to combine analysis across more than one spatial scale).