
Figures & data
Figure 1. Overview of the four steps in the modeling procedure to simulate different distribution scenarios for individual transferable quota.
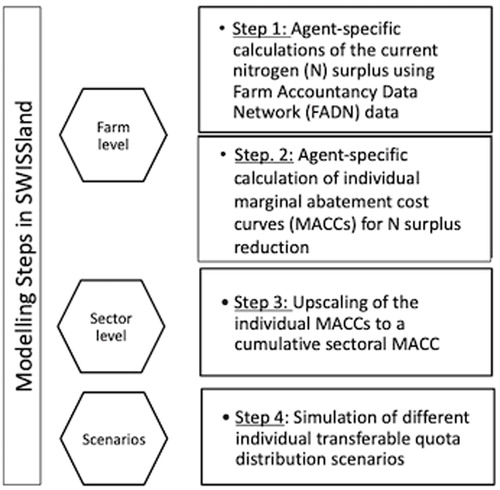
Figure 2. The model calculates for every agent a farm gate nitrogen (N) balance to estimate the N surplus. The agent can reduce the N surplus by the reduction of inputs or by changing the production to products with higher N use efficiencies.
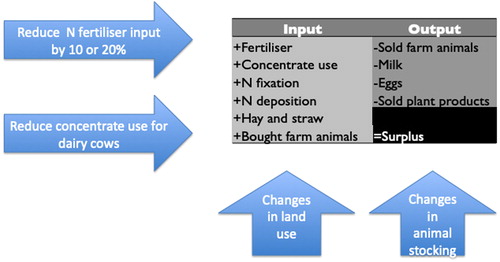
Figure 3. Average nitrogen (N) abatement costs for different farm types (see typology in Table A.1 in the appendix [online supplemental data]) with standard deviation (estimated per farm; 1 CHF ≈ 1 USD).
![Figure 3. Average nitrogen (N) abatement costs for different farm types (see typology in Table A.1 in the appendix [online supplemental data]) with standard deviation (estimated per farm; 1 CHF ≈ 1 USD).](/cms/asset/a4362d4f-d3ed-4d34-b37a-45897b6e3b3c/cjep_a_1823344_f0003_c.jpg)
Figure 4. Marginal abatement costs of individual model agents in relation to the N surplus for a reduction of (a) 10% and (b) 70% of the initial surplus.
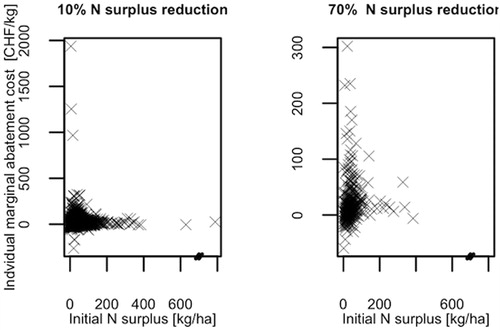
Figure 5. Cumulative marginal abatement cost curve for the whole agricultural sector (1 CHF ≈ 1 USD).
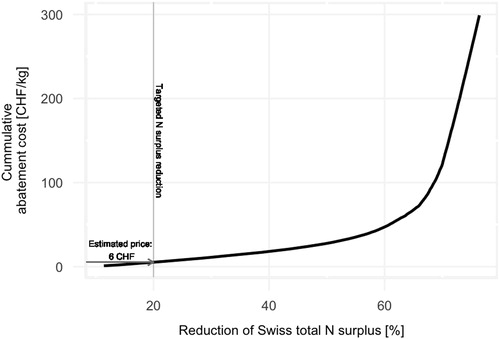
Figure 6. Effects of NSP trading with distribution based on area or based on a grandfathering scheme in comparison with a default reduction of 80% of the initial N surplus on (a) average farm income and (b) average farm size (c) exit rate and (d) N surplus of different farm types.
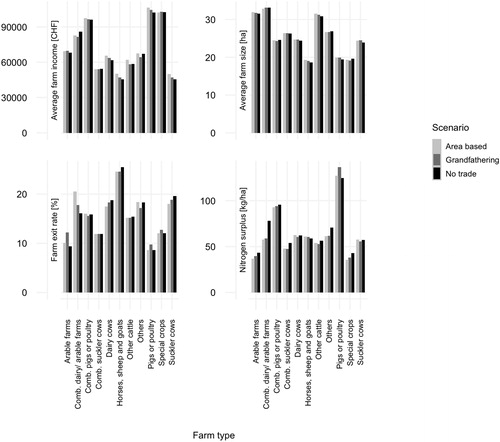
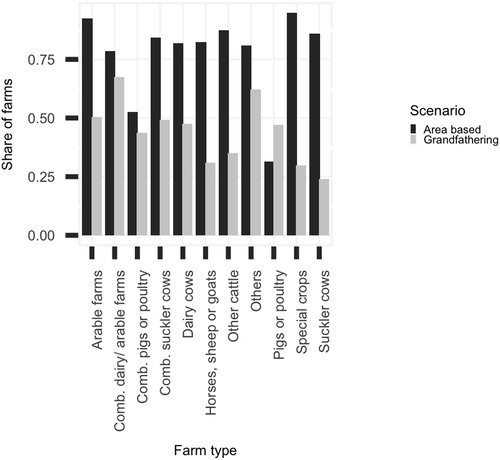
Figure 7. Share of farms selling nitrogen surplus permits (NSP) in combination with a reduction in N surplus in the two NSP scenarios.
CJEP-2020-0018.R2_Appendix.docx
Download MS Word (22.8 KB)Data availability
A summary of the Farm Accountancy Data Network (FADN) data that supports the findings of this study is available in Hoop and Schmid (Citation2013). Restrictions apply to the availability of these data, which were used under license for this study. Data can be requested from Agroscope, Ettenhausen.