Figures & data
Figure 1. Flow chart of the optimization procedure. Problem Definition: together with stakeholders the problem and the required steps were defined. Input: The input consists of raw data processed to urban ecosystem service layers. These layers are combined to form the urban ecosystem service hotspot map. The decision space is mapped using Land cover, Master Plan and Buildings floor plan. Model: The core of the model (NSGA-II algorithm) minimizes loss of urban ecosystem services and maximizes compactness simultaneously. Output: After 5,000 iterations, the produced output data is further inspected. The resulting graphs and maps are analyzed and compared using the features of a decision support system. Stakeholder Feedback: The parameters are adapted depending on the feedback of the stakeholder. The iterative loop with the stakeholders is indicated in blue. Colour online.
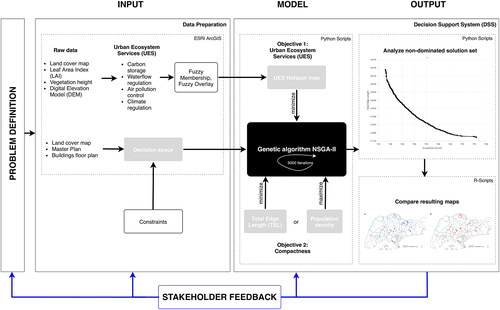
Figure 2. Map of the island city-state of Singapore, located south of the Malayan Peninsula. The land cover map shows 6 land cover classes based on Dissegna et al. (Citation2019).
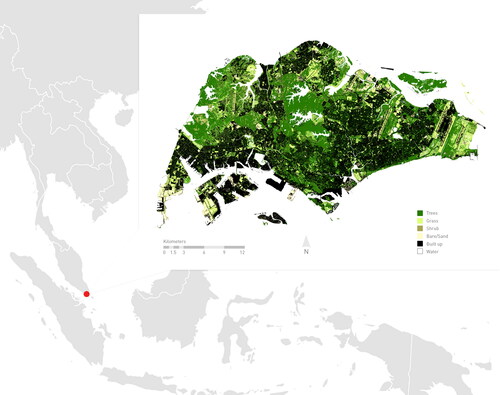
Figure 3. The total area zoned as residential area on the mainland of Singapore according to the Master Plan 2014 (blue and red pixels combined). The non-built-up residential area of Singapore’s mainland (red pixels) constitutes the decision space where allocation of new residential pixels is considered. Colour online.
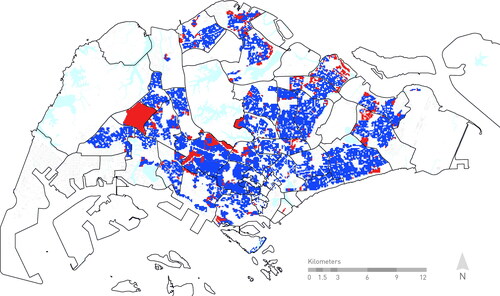
Figure 4. The urban ecosystem service hotspots were mapped using ecosystem service models of air pollution control, carbon storage, climate control and water flow regulation. Low values (blue) indicate low ecosystem service provision while high values (red) indicate high provision of multiple ecosystem services.
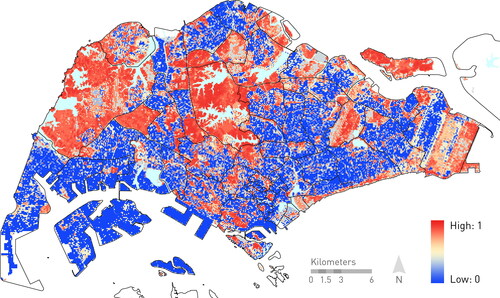
Figure 5. Robust optimal solutions for possible new residential development areas in Singapore, based on (a) minimizing urban ecosystem service loss and maximizing areas of high population density (leading to 1,158 robust solution pixels in blue) or (b) minimizing urban ecosystem service loss and reducing the Total Edge Length of all built-up areas (resulting in 1,077 robust solution pixels in red). Colour online.
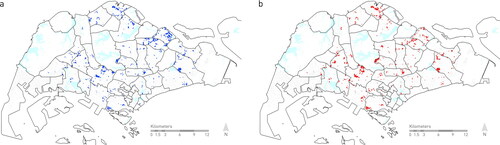
Table 1. Changes in the amount of urban (built-up) pixels in the present (Baseline 2020) compared with two allocation scenarios of new residential areas until 2030. The comparison is presented for two compactness measures, population density and Total Edge Length (TEL).
Figure 6. Mapping the distribution of optimal new residential areas in the Planning Area of Punggol using the minimization of the two objectives loss of urban ecosystem services (UES) and Total Edge Length (TEL). (a) In the solution on the left side of the non-dominated front 122 pixels are converted to new residential areas. (b) In the right side of the non-dominated front 82 pixels are converted to new residential areas. The analysis of the solutions along the non-dominated front allows to launch a discussion about allocation possibilities among decision-makers.
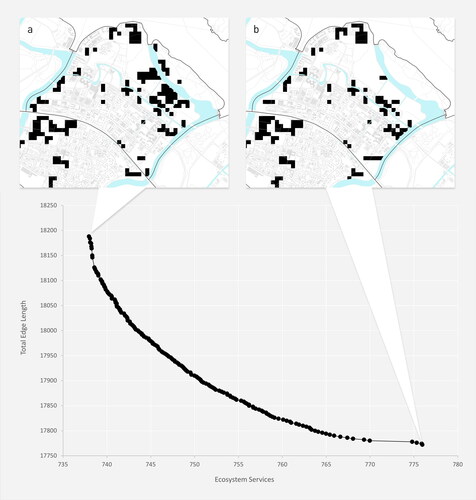
Table 2. Comparison of the amount of pixels allocated to new residential areas between the present situation (Baseline 2020) and the left side of the non-dominated front or the right side of the non-dominated front in Punggol until 2030.
Figure 7. The allocation of new residential areas modeled in two time steps: in time step 1 from 2020-2025, there were 622 new residential pixels allocated (red), and in time step 2 from 2025-2030, there were 622 new residential pixels allocated (blue). Areas in (1) or (3) predominantly get converted in time step 1, whereas areas in (2) or (4) as well as (5) are predominantly converted in time step 2. Colour online.
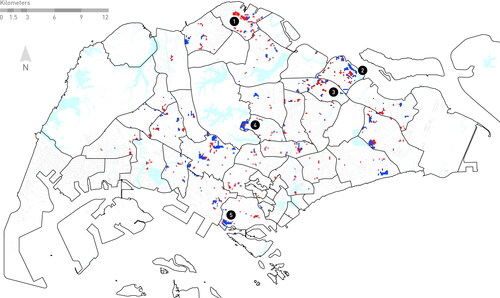
Figure 8. Temporal urban growth simulation patterns in the Planning Area of Tengah from black (pixels converted in the first time step, higher in priority) to bright gray (pixels converted in the last time step, lower in priority). (a) The temporal urban growth pattern simulated on a blank space, without consideration of future transportation nodes. (b) The temporal urban growth pattern simulated including approximate locations of future transportation nodes as urban growth seeds (blue points). Colour online.
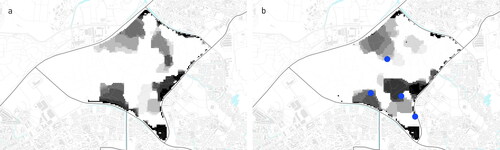
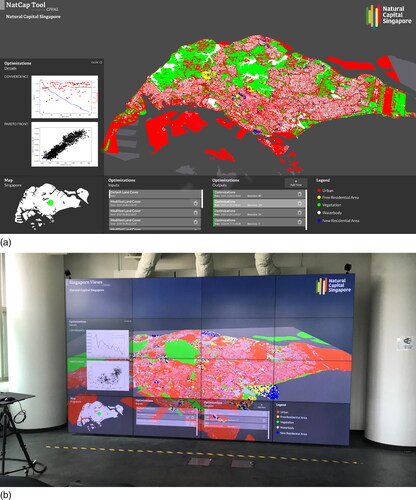
Figure 9. (a) The multi-objective optimization was integrated into the interactive 3D GIS platform Singapore Views and (b) displayed in the Value Lab Asia at the Singapore ETH-Center (SEC).