
Figures & data
Figure 1. Conceptual scheme.
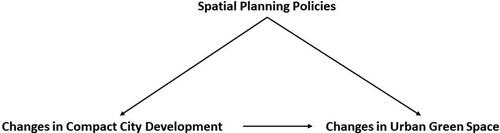
Figure 2. Location of case studies.
Source: OIS (2018); Statbel (Citation2018); Esri (Citation2019). Design by author.
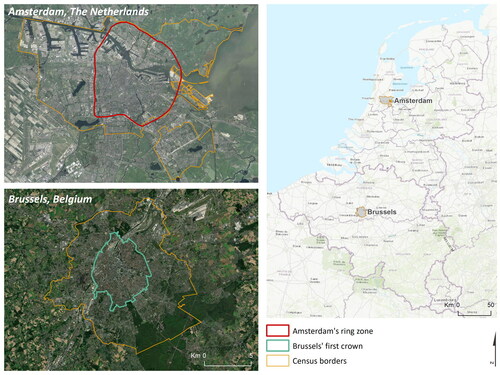
Table 1. Satellite images and band information.
Table 2. Amsterdam classification accuracy assessments.
Table 3. Brussels classification accuracy assessments.
Table 4. UGS and compact city indicators.
Table 5. List of interviewees.
Figure 3. Land-use changes in Amsterdam.
Source: Digital Globe (Citation2003, Citation2016). Design and calculations are made by the authors.
*Urban land includes built-up space as well as non-vegetated barren land.
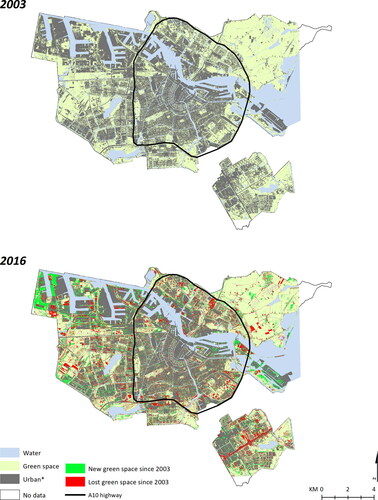
Table 6. Land-use statistics.
Table 7. Key policy instruments for urban greenspace and development.
Figure 4. Land-use changes in Brussels.
Source: Digital Globe (Citation2003, Citation2016). Design and calculations are made by the authors.
*Urban land includes built-up space as well as non-vegetated barren land.
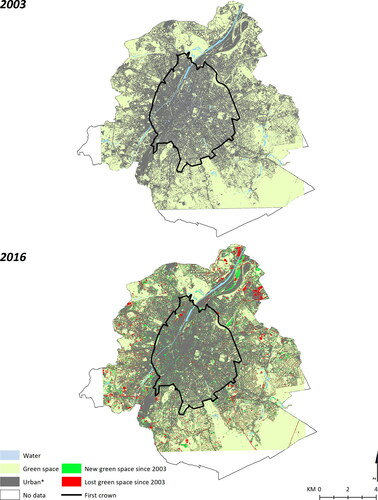
Table 8. Summary of differences and similarities between Amsterdam and Brussels.