
Figures & data
Figure 1. Vuoksi River Basin District and the ecological classification of its freshwater water bodies (n = 1,530). The border between southern and northern Vuoksi is shown on the map with a bold black line.
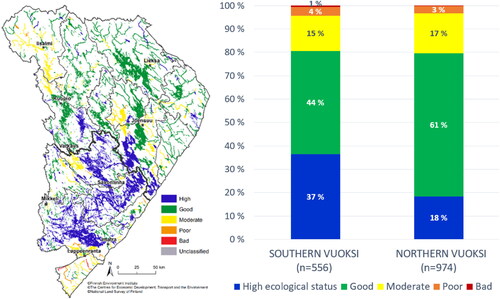
Figure 2. Sample description used on the questionnaire.
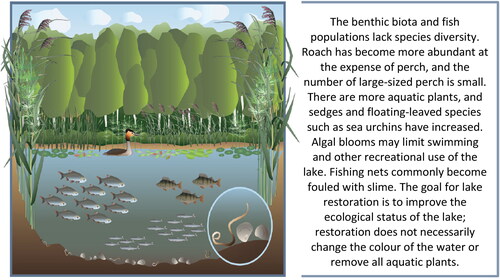
Figure 3. Willingness to pay questions.
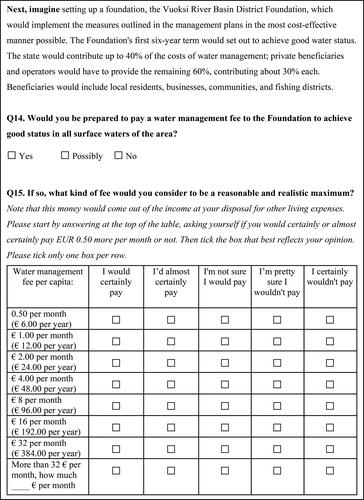
Table 1. Sample, zero-protest responses, and population characteristics.
Figure 4. The monitored ecological status classification (an ex-post GIS analysis, darker bars) and the perceived water quality (from the survey results, lighter bars) of the respondents’ focal body of water (n = 200).
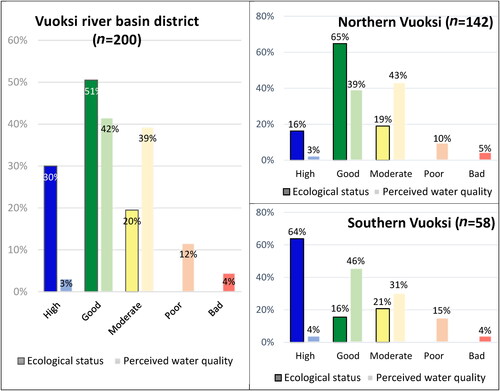
Table 2. Descriptive statistics.
Table 3. Probit model for predicted probability of divergence between perceived and classified status.
Figure 5. Left: Classified distribution of mean WTP (2014) in southern and northern Vuoksi (n = 73 and n = 165; N = 238); Right: Non-parametric estimates for mean WTP values, standard deviation, and standard errors.
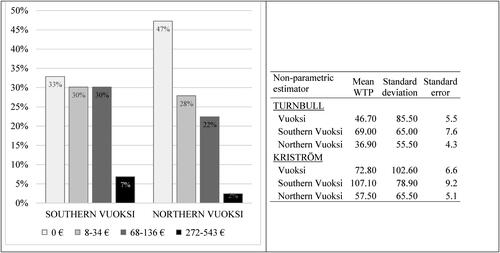
Table 4. Ordered probit model on the level (0–3) of mean WTP for improved ecological status in Vuoksi (marginal effects).