
Figures & data
Table 1. Summary of transition pathways, type of contribution and associated engagement modes.
Figure 1. Theory of change diagram. Inspired by (Kellogg Foundation Citation2004; Morra Imas and Rist Citation2009).
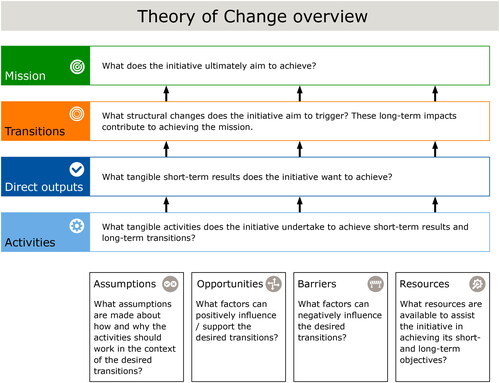
Figure 2. Theory of change tiny forest programme.
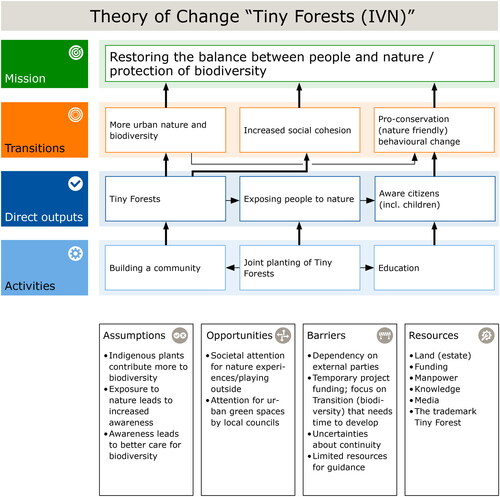
Figure 3. Theory of change beach clean-ups.
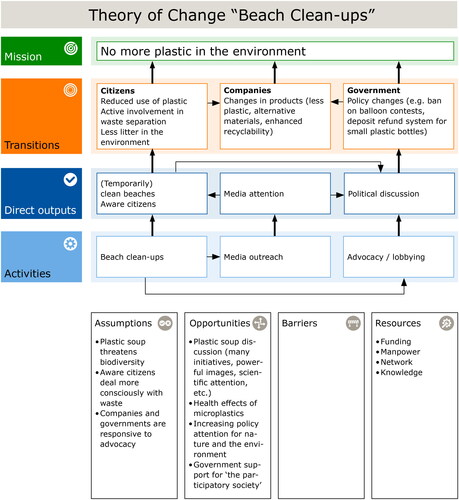
Table 2. Main similarities and differences in the ToC approaches and key success factors of IVN Tiny Forests and beach clean-ups. Numbering for reference purposes.
Supplemental material
Supplemental Material
Download MS Word (23.8 KB)Data availability statement
Anonymised interview summaries and survey results (all in Dutch) are available from the corresponding author upon reasonable request.