
Figures & data
Figure 1. Study area. Numbers indicate areas surveyed; color coding: area treated with Bti (red), water areas (blue), forests (dark green), agricultural areas (light green), settlement areas (grey). Colour online.
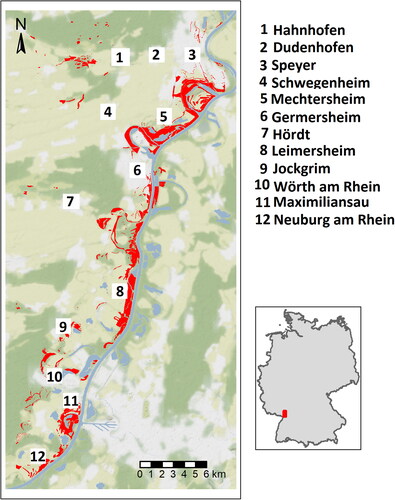
Figure 2. Costs and benefits of mosquito control with Bti. The figure shows the effects of the current mosquito control with Bti. The effects of Bti on mosquitoes and midges are shown in blue, the resulting benefits for the population in green and the costs in red. The net added value of mosquito control for the society is shown in gray. The examples given are only a selection of important effects and do not claim to be exhaustive. Colour online.
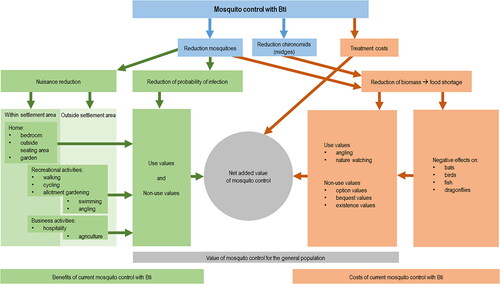
Table 1. Results of the regression analysis.
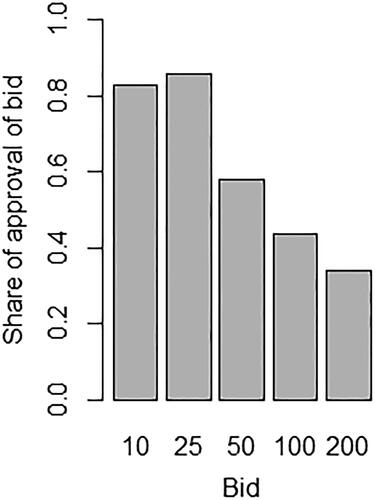
Figure 3. Share of approval of bid.
Supplemental material