
Figures & data
Figure 1. Theoretical research framework: Basic and extended Technology Acceptance Model.
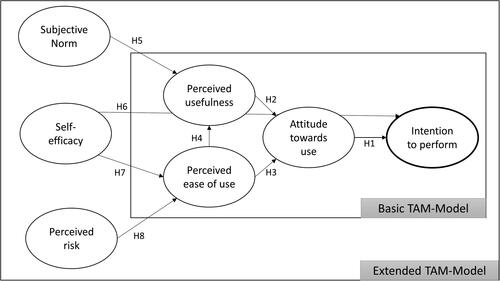
Table 1. Reliability and validity testing.
Table 2. Quality indicators for the assessment of the overall fit of the basic and extended TAM.
Table 3. Basic TAM and extended TAM – squared multiple correlations R².
Figure 2. Tested extended TAM structural model with standardized path coefficients and explained variances.
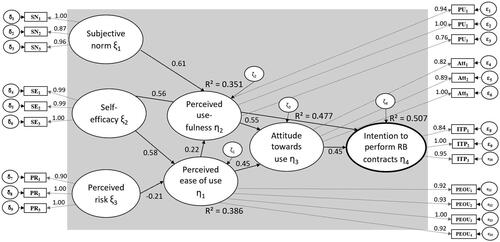
Table 4. Tested structural model – results.
Supplemental material