Figures & data
Figure 1. Organisation of UK climate governance, 2019
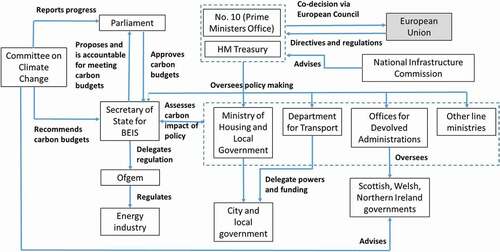
Figure 2. UK emissions reductions targets
Figure 3. Greenhouse gas emissions, UK and OECD average 1990–2018 (1990 = 100)
Sources: OECD (https://stats.oecd.org/Index.aspx?DataSetCode=AIR_GHG), BEIS/National Statistics, 2019. 2018 UK Greenhouse gas emission, Provisional figures. Statistical Release: National Statistics. https://assets.publishing.service.gov.uk/government/uploads/system/uploads/attachment_data/file/790626/2018-provisional-emissions-statistics-report.pdf
Note: Excludes LULUCF
Figure 4. Sectoral emissions 1990–2018, (MtCO2e)
Source: Committee on Climate Change, https://www.theccc.org.uk/publication/reducing-uk-emissions-2019-progress-report-to-parliament/#supporting-charts-and-data