Figures & data
Figure 1. Number of NSAs active at COP and included in delegations (1997–2011).
Table 1. Summary table of variables.
Figure 2. Business bias across countries (n = 72): positive score means there is business bias; negative score highlights an NGO bias.
Table 2. Logit analysis predicting likelihood of an organization participating in a country delegation at the COPs.
Figure 3. Predicted chance of being included in the delegation by group type (business & NGO).
Figure 4. Average marginal effects of being included in the delegation by group type and a country’s wealth (GDP/capita).
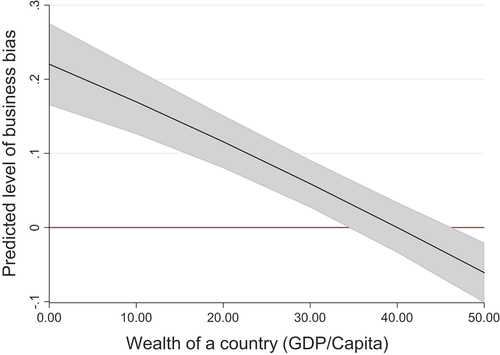
Figure 5. Average marginal effects of being included in the delegation by group type and a country’s dependence on fossil fuels (World Bank).
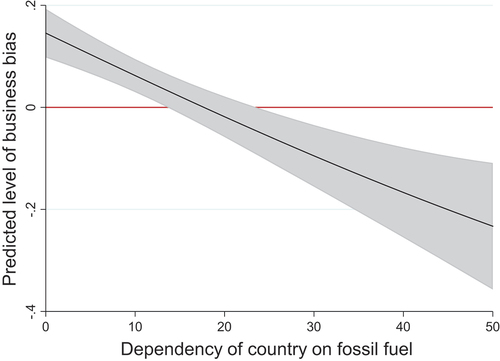
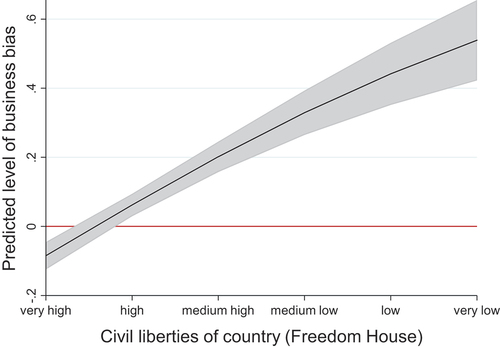
Figure 6. Average marginal effects of being included in the delegation by group type and a country’s level of democracy (POLITY index).
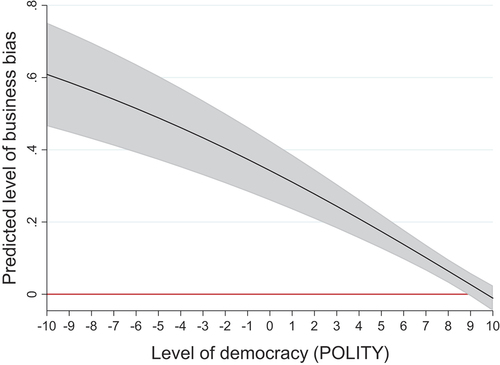
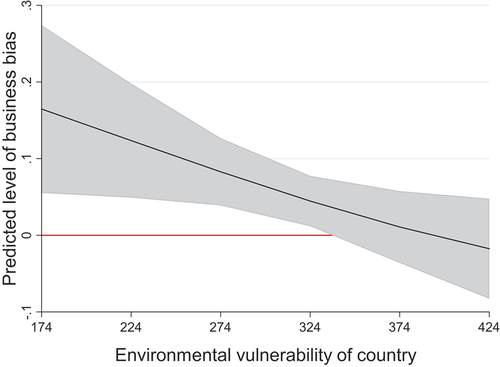
Figure 7. Average marginal effects of being included in the delegation by group type and a country’s vulnerability to climate change (UNEP).