Figures & data
Figure 1. Evolution of reading achievement in Eastern Europe.
Note: The figure shows the demeaned reading score for each Eastern European entrant in each survey wave between 2000 and 2015. The score was demeaned by the average of all 32 countries in the sample. The red, dashed, vertical line signals the 2004 entries of the Czech Republic, Estonia, Hungary, Lithuania, Latvia, Poland, the Slovak Republic, and Slovenia. The green, dashed, vertical line indicates the 2007 entries of Bulgaria and Romania. The blue, dashed, vertical line designates the 2013 entry of Croatia. Country abbreviations stand for: Bulgaria (BGR), the Czech Republic (CZE), Estonia (EST), Croatia (HRV), Hungary (HUN), Lithuania (LTU), Latvia (LVA), Poland (POL), Romania (ROU), the Slovak Republic (SVK), and Slovenia (SVN).
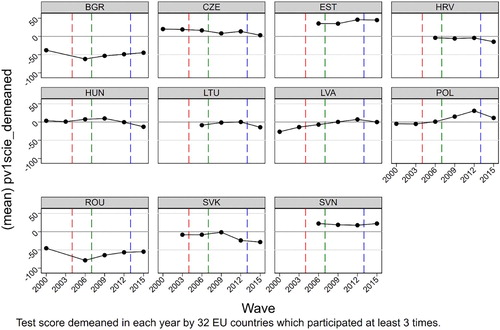
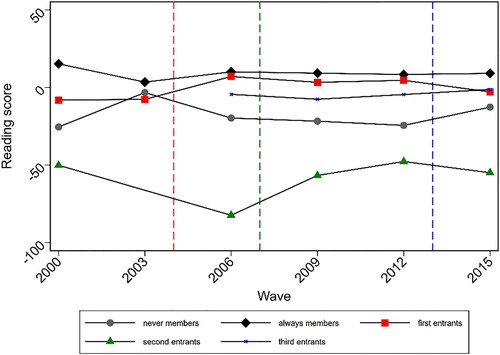
Figure 2. Parallel trends of reading score by treatment and control group.
Note: The graphs depict the evolution of the demeaned reading score over time in the different treatment and control groups. The reading score was demeaned by the sample average to absorb time trends. The treatment group composes of the red markers indicating the first round of EU entrants, the green markers for the second round, and the blue markers for the third round. The control group consists of the black markers standing for permanent EU members, and the gray markers for permanent non-EU members. The figure shows the reading score in each survey wave between 2000 and 2015. The red, dashed, vertical line signals the 2004 entries. The green, dashed, vertical line indicates the 2007 entries. The blue, dashed, vertical line designates the 2013 entry. The first group of EU entrants contains the Czech Republic, Estonia, Hungary, Lithuania, Latvia, Poland, the Slovak Republic, and Slovenia; the second group includes Bulgaria and Romania; and the third entrants group is formed by Croatia. Permanent EU members are Austria, Belgium, Denmark, Finland, France, the United Kingdom, Greece, Ireland, Italy, Luxembourg, the Netherlands, Portugal, and Sweden. Permanent non-EU members are Albania, Iceland, Montenegro, Norway, and Serbia.