
Figures & data
Table 1. Possible states and activities in the sequence data.
Table 2. Sequence indel and substitution costs.
Figure 1. Full sample sequence index plot.
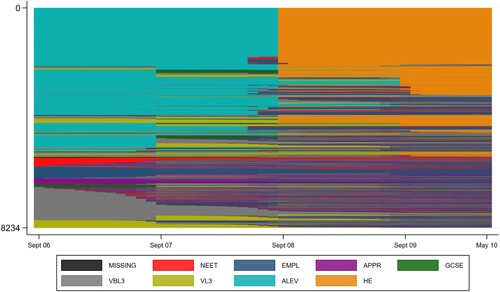
Figure 2. Full sample sequence distribution plot.
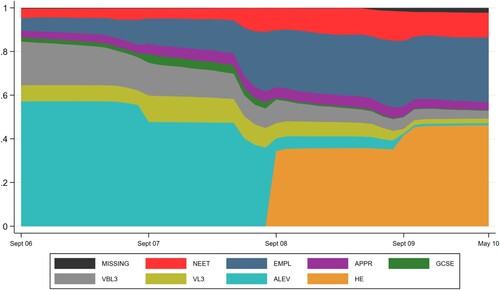
Figure 3. Six-pathway typology sequence index plots – 45-month sequences.
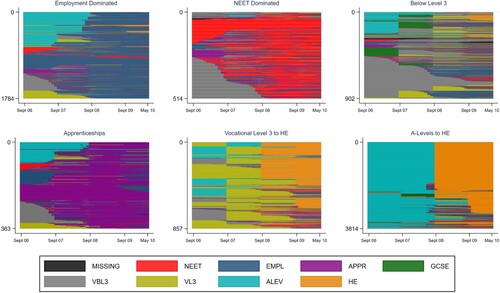
Figure 4. Six-pathway typology modal plot of sequences.
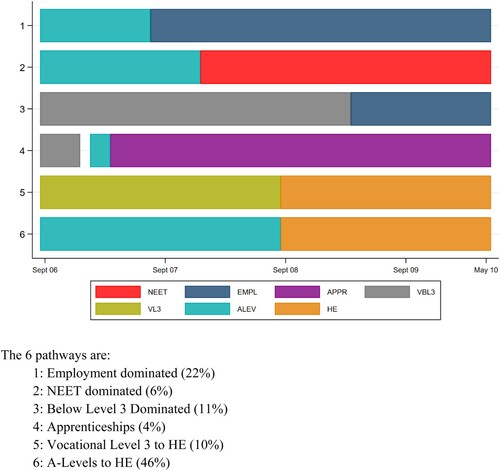
Table 3. Age 25 (Wave 8) labour market outcomes by pathway.
Table 4. Bias-adjusted coefficients based on Oster (Citation2019).
Table 5. Characteristics influencing pathway choice: Multinomial logit marginal effect estimates.
Table 6. Assessment of prediction accuracy.
Supplemental material