
Figures & data
Table 1. Next steps data used to construct non-cognitive skill measures.
Table 2. Sample descriptive statistics: means and proportions of variables of interest.
Table 3. Comparison groups used in this paper.
Figure 1. Non-cognitive skills, raw and conditional means.
Notes: N = 4937, 6538, 7259 and 7507, respectively. Weighted using Wave 8 weights. Conditional means control for gender, age, number of siblings, region, whether the young person is a care leaver, whether the young person had a low birth weight or was born prematurely, ethnicity, mother’s social class, father’s social class, age of mother, age of father, single parent household, income deprivation, disability, whether their grandparent attended university, Free School Meal (FSM) status, private school, the highest qualification of the mother and father, and Key Stage 2 quintile of achievement. Source: University College London, UCL Institute of Education, Centre for Longitudinal Studies. (Citation2018).
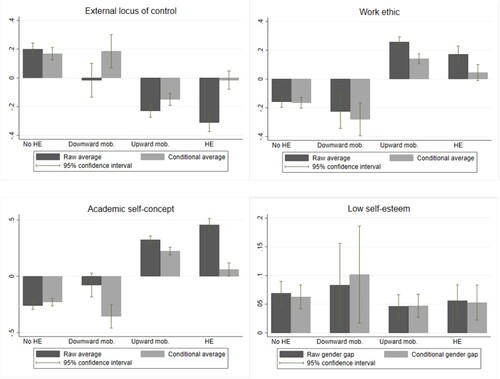
Table 4. The relationship between non-cognitive skills and university attendance among potential first-generation individuals.
Figure 2. The gender gap in non-cognitive skills.
Notes: Positive gaps indicate that women have higher level of a skill. Total N = 4937, 6538, 7259 and 7507, respectively. Weighted using Wave 8 weights. Conditional gender wage gap models control for age, number of siblings, region, whether the young person is a care leaver, whether the young person had a low birth weight or was born prematurely, ethnicity, mother’s social class, father’s social class, age of mother, age of father, single parent household, income deprivation, disability, whether their grandparent attended university, Free School Meal (FSM) status, private school, the highest school qualification of the mother and father, and their Key Stage 2 quintile of achievement. Source: University College London, UCL Institute of Education, Centre for Longitudinal Studies. (Citation2018).
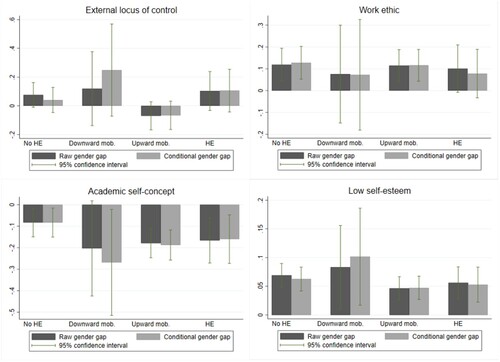
Table 5. The relationship between non-cognitive skills and university attendance, by gender*non-cognitive skills interactions (sample of potential first-generation individuals).
Table 6. Kitagawa-Blinder-Oaxaca decomposition of university attendance among potential first-generation individuals and children of graduate parents.
Table 7. Kitagawa-Blinder-Oaxaca decomposition of university attendance among potential first-generation individuals and children of graduate parents: the role of age 16 test (GCSE) scores.